Answered step by step
Verified Expert Solution
Link Copied!

Question

1 Approved Answer

Could I please have help answering these questions that go along with the pictured graph and summary statistics (of the graph)? I am unsure of

Could I please have help answering these questions that go along with the pictured graph and summary statistics (of the graph)? I am unsure of how to find the mean of the sampling distribution as well as the standard deviation. I am unsure if these answers are provided in the summary statistics, because there are 2 means and 2 standard deviations shown. Thank you!

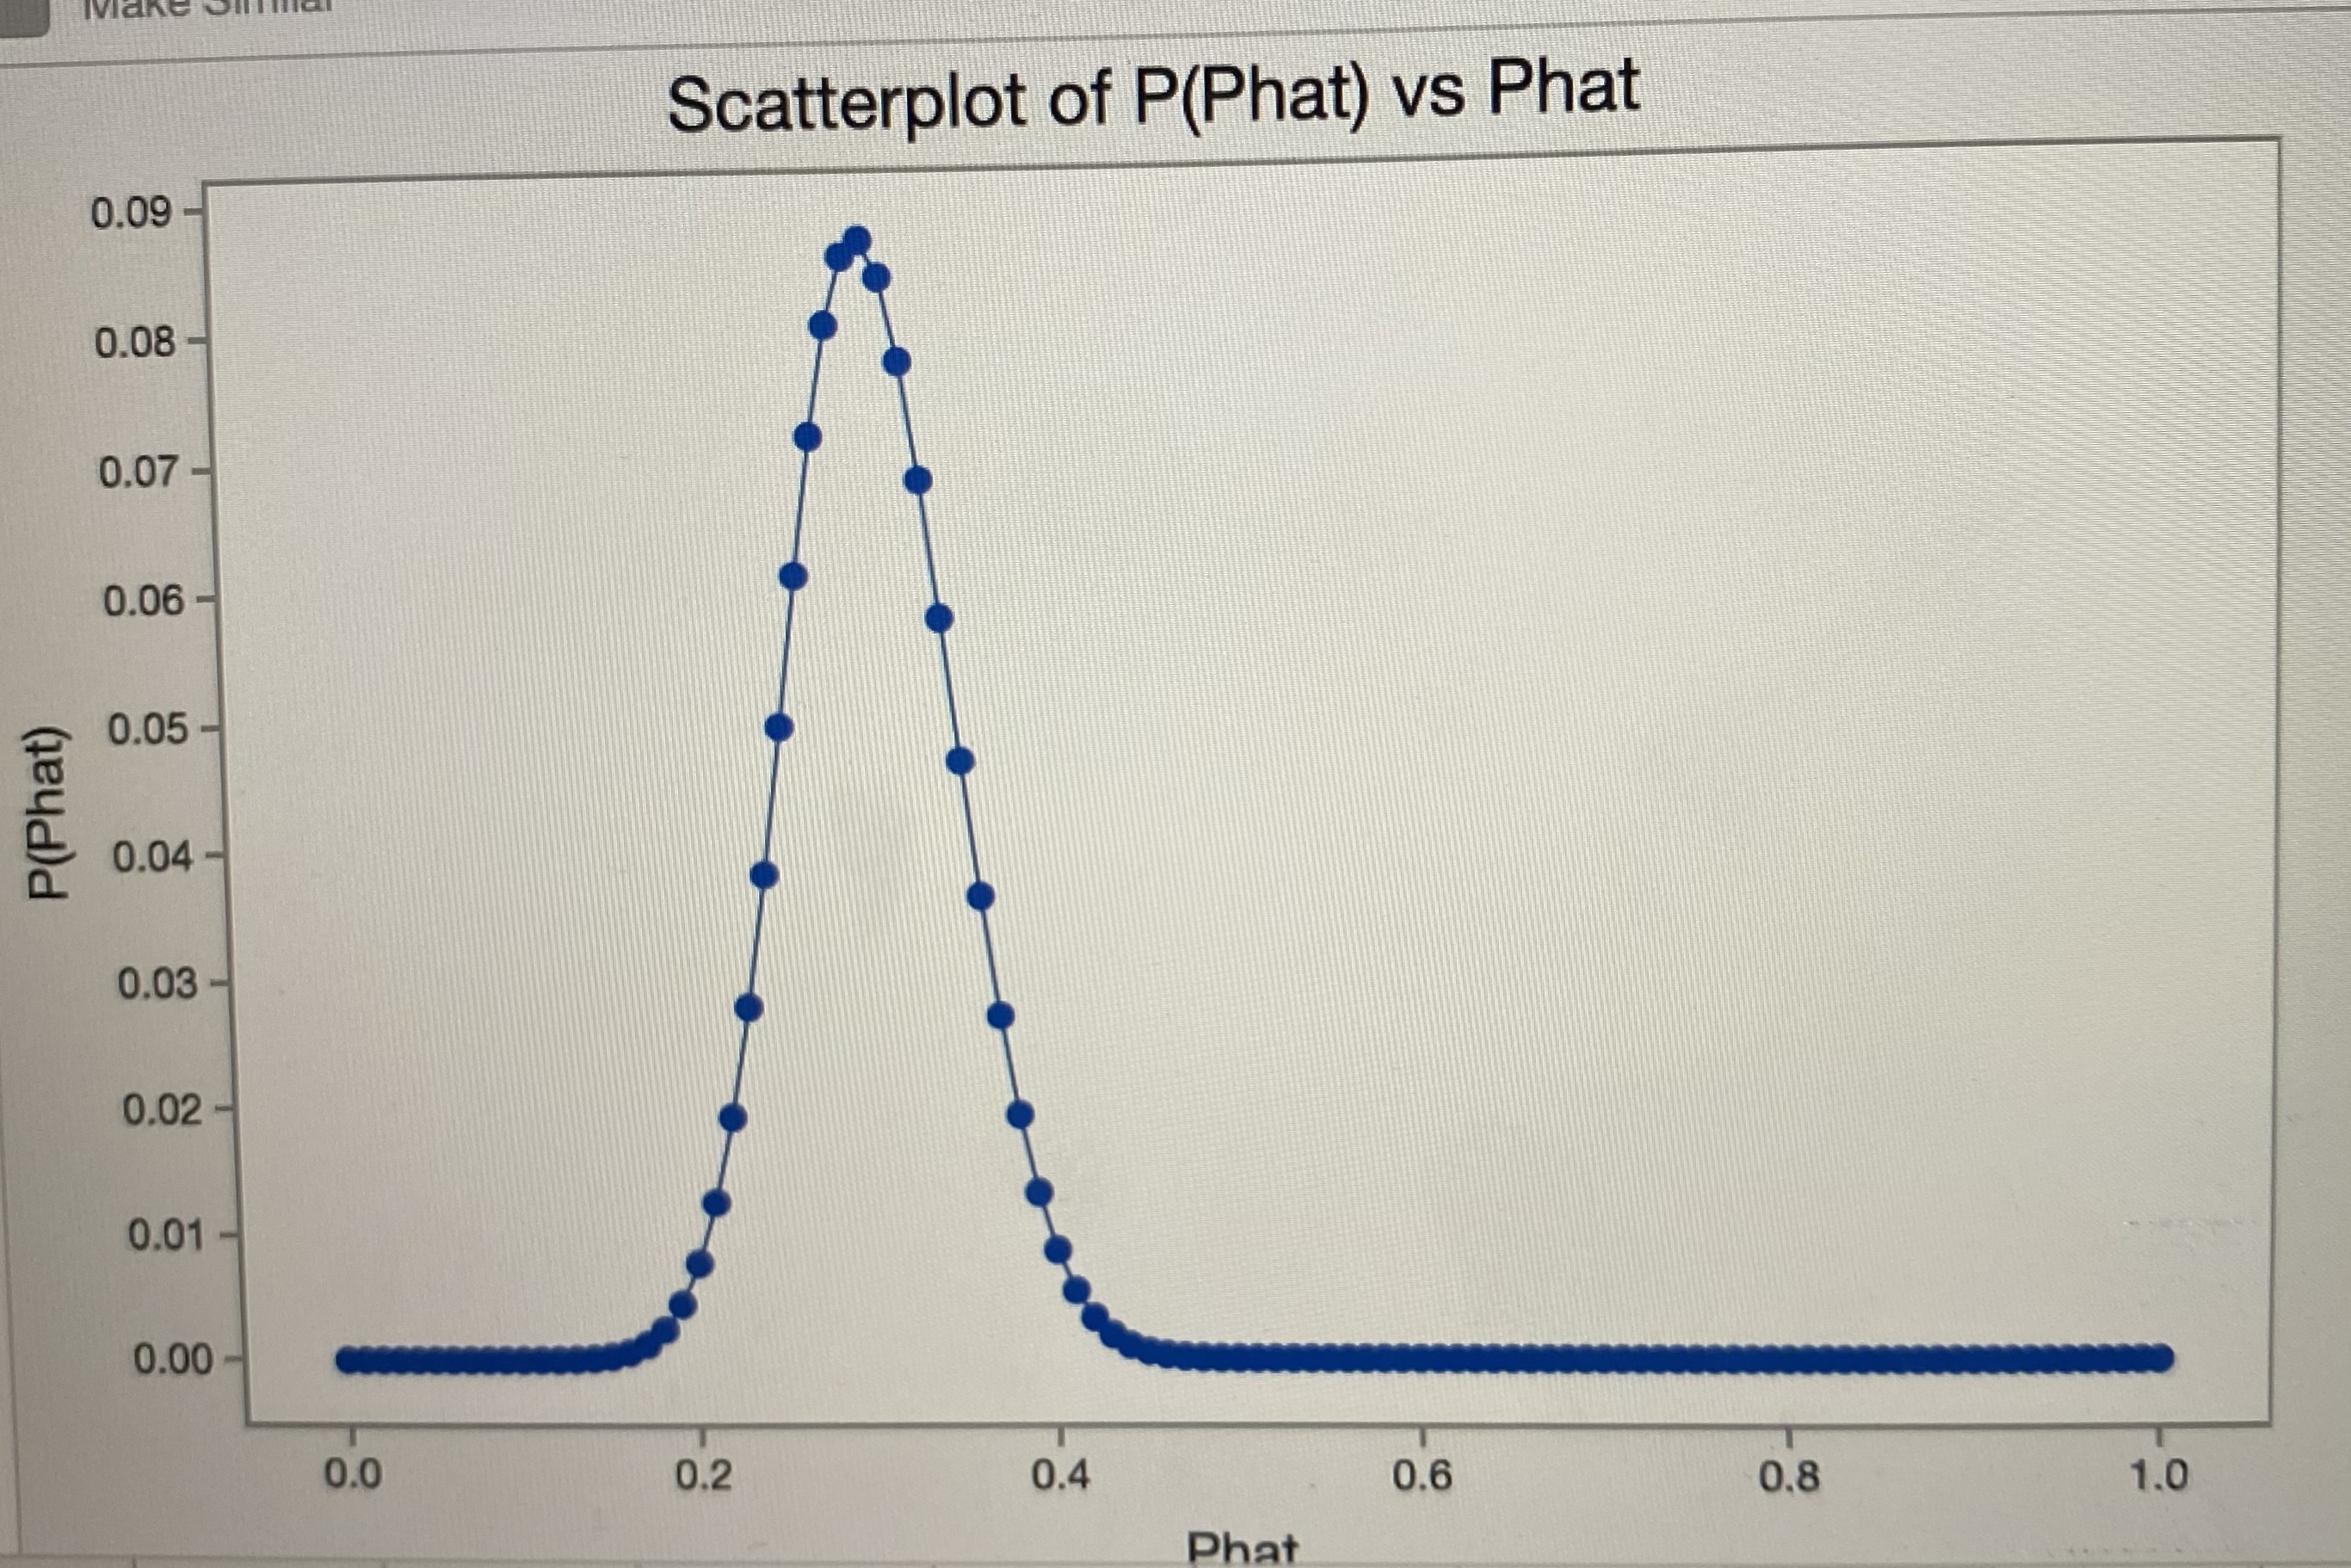
image text in transcribedimage text in transcribedimage text in transcribed
\f\fUse Graphs > Scatterplot with option Single Y Variable "simple" selected to plot P(phat) (y-axis) v. phat (x- axis). Click on the graph to select it, and click on the "+" sign that appears beside the graph to display the Graph Elements menu and check "Data Display" to add a connecting line. Examine the plot. 1. Is the pattern of probabilities approximately bell-shaped? 2. Determine the mean of the sampling distribution of p , p= 3. Calculate the standard deviation of the sampling distribution of p, p(1- p) 100 Keep at least 3 decimals in your

Step by Step Solution

There are 3 Steps involved in it

Step: 1

blur-text-image

Get Instant Access to Expert-Tailored Solutions

See step-by-step solutions with expert insights and AI powered tools for academic success

Step: 2

blur-text-image

Step: 3

blur-text-image

Ace Your Homework with AI

Get the answers you need in no time with our AI-driven, step-by-step assistance

Get Started

Recommended Textbook for

Finite Mathematics and Its Applications

Authors: Larry J. Goldstein, David I. Schneider, Martha J. Siegel, Steven Hair

12th edition

978-0134768588, 9780134437767, 134768582, 134437764, 978-0134768632

More Books

Students also viewed these Mathematics questions