Answered step by step
Verified Expert Solution
Link Copied!

Question

1 Approved Answer

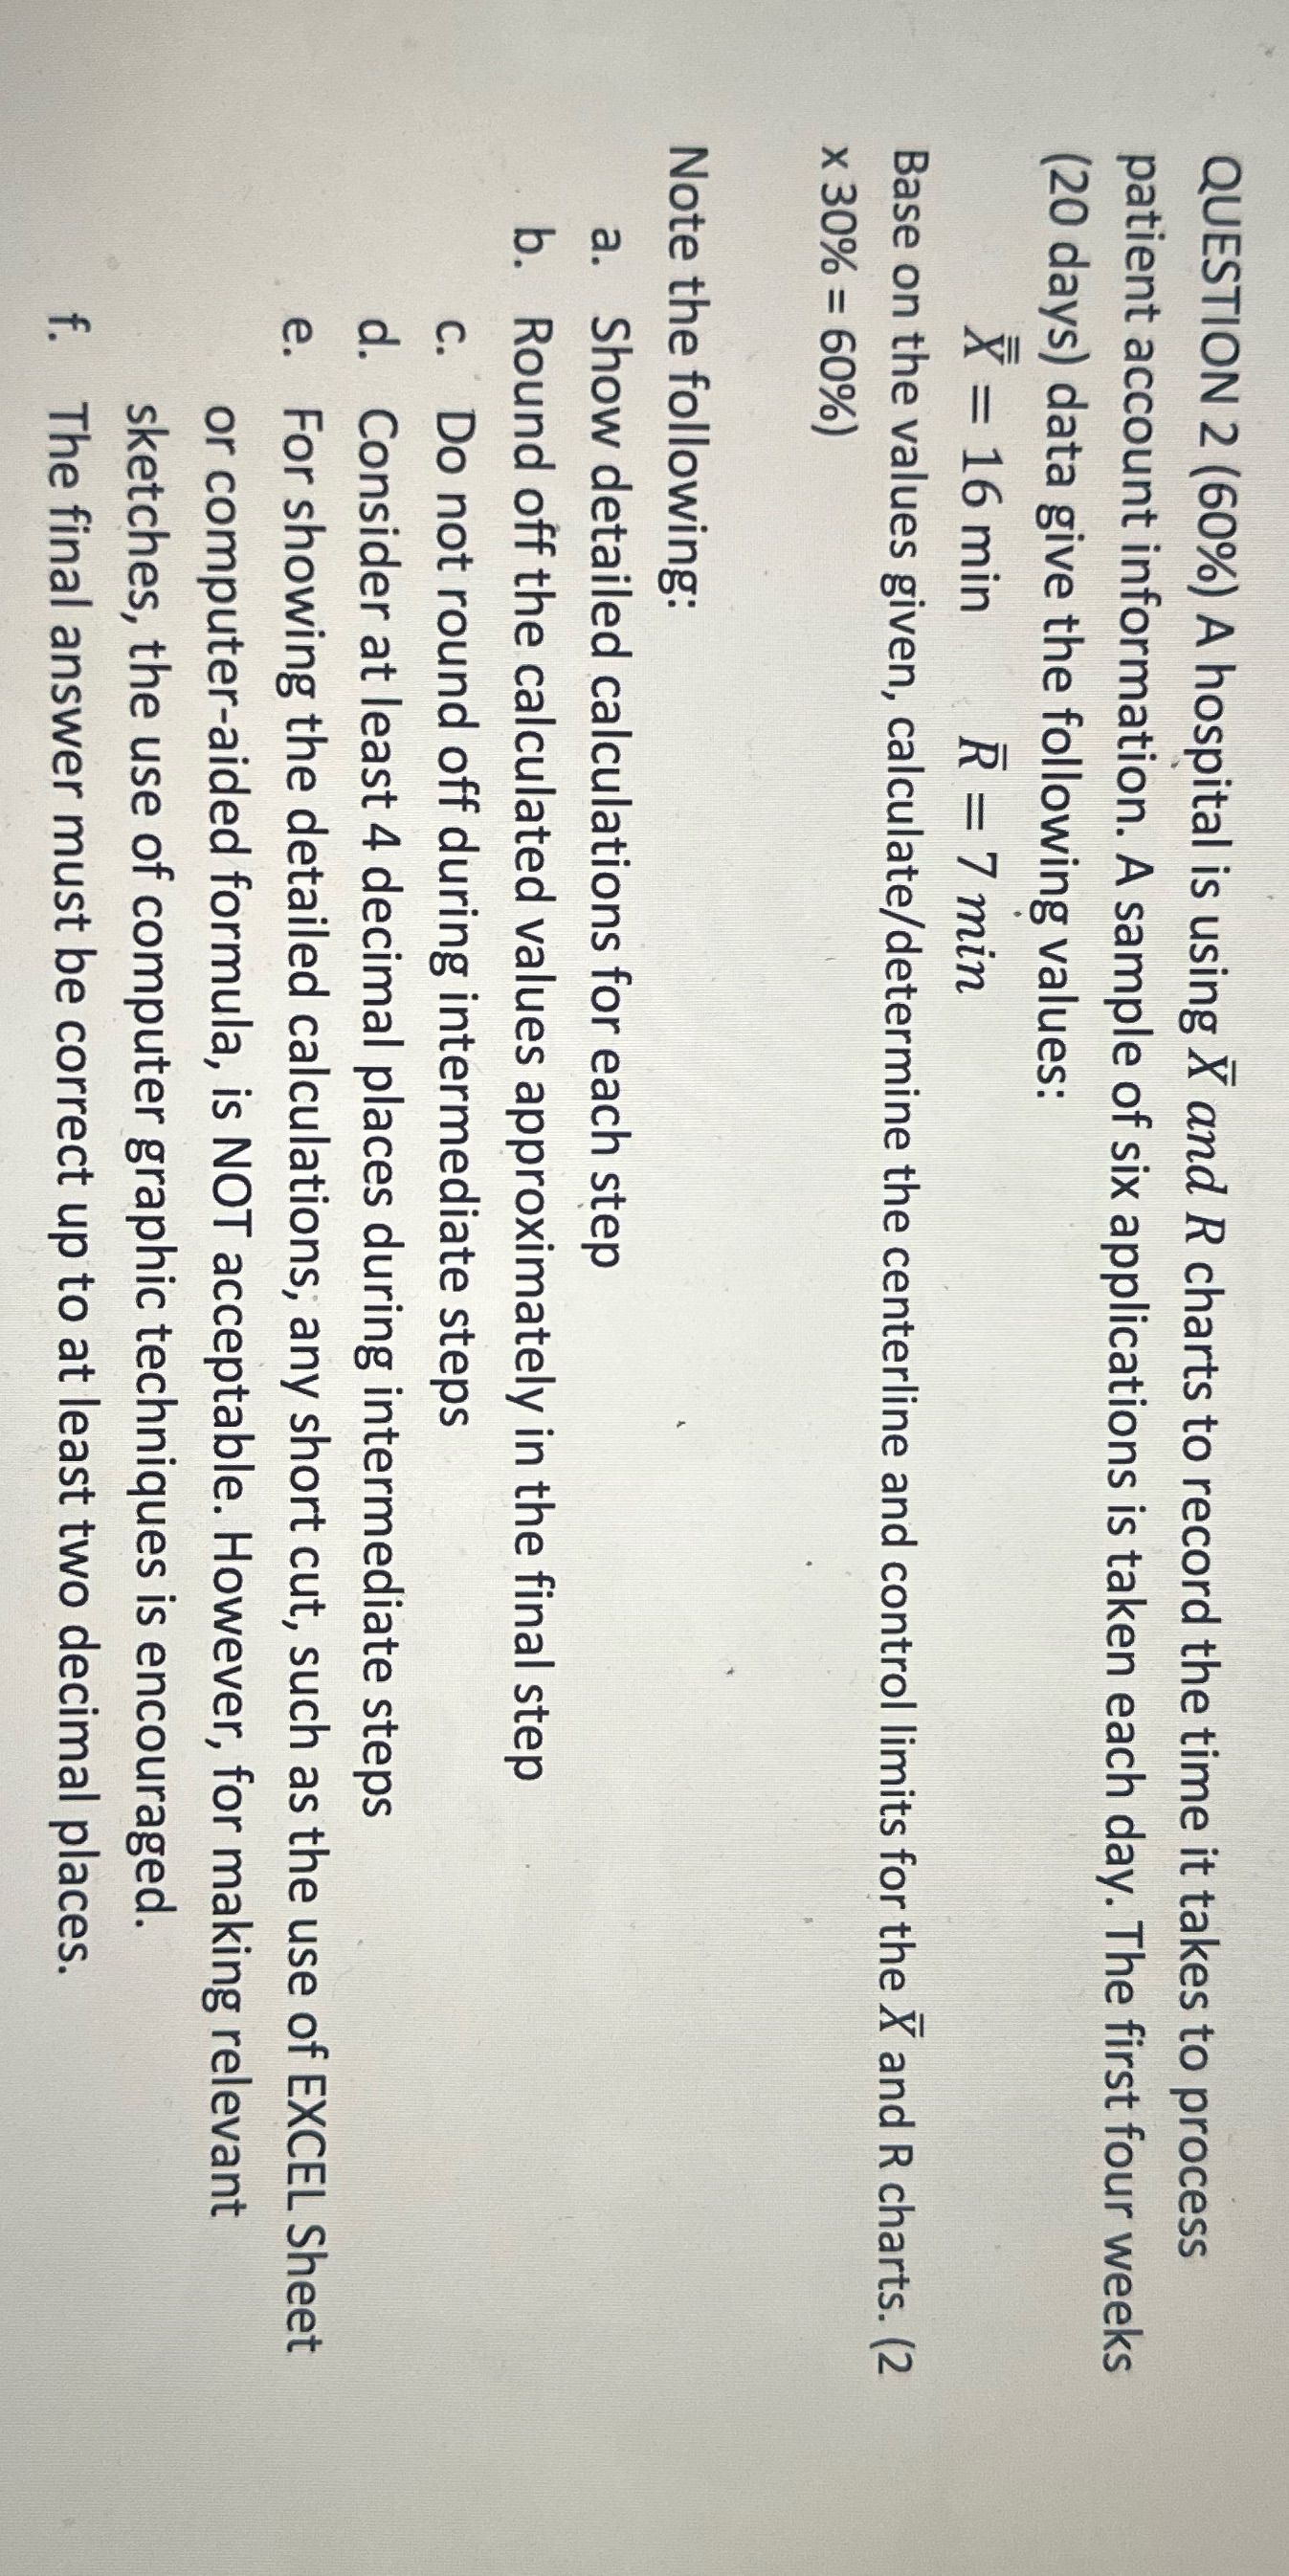
Could please this question QUESTION 2 (60%) A hospital is using X and R charts to record the time it takes to process patient account

Could please this question

image text in transcribed
QUESTION 2 (60%) A hospital is using X and R charts to record the time it takes to process patient account information. A sample of six applications is taken each day. The first four weeks (20 days) data give the following values: X = 16 min R = 7 min Base on the values given, calculate/determine the centerline and control limits for the X and R charts. (2 x 30% = 60%) Note the following: a. Show detailed calculations for each step b. Round off the calculated values approximately in the final step c. Do not round off during intermediate steps d. Consider at least 4 decimal places during intermediate steps e. For showing the detailed calculations, any short cut, such as the use of EXCEL Sheet or computer-aided formula, is NOT acceptable. However, for making relevant sketches, the use of computer graphic techniques is encouraged. f. The final answer must be correct up to at least two decimal places

Step by Step Solution

There are 3 Steps involved in it

Step: 1

blur-text-image

Get Instant Access to Expert-Tailored Solutions

See step-by-step solutions with expert insights and AI powered tools for academic success

Step: 2

blur-text-image

Step: 3

blur-text-image

Ace Your Homework with AI

Get the answers you need in no time with our AI-driven, step-by-step assistance

Get Started

Recommended Textbook for

Vector Mechanics for Engineers Statics and Dynamics

Authors: Ferdinand Beer, E. Russell Johnston, Jr., Elliot Eisenberg, William Clausen, David Mazurek, Phillip Cornwell

8th Edition

73212229, 978-0073212227

More Books

Students also viewed these Mechanical Engineering questions