Could someone answer from the fifth to the last question,please?
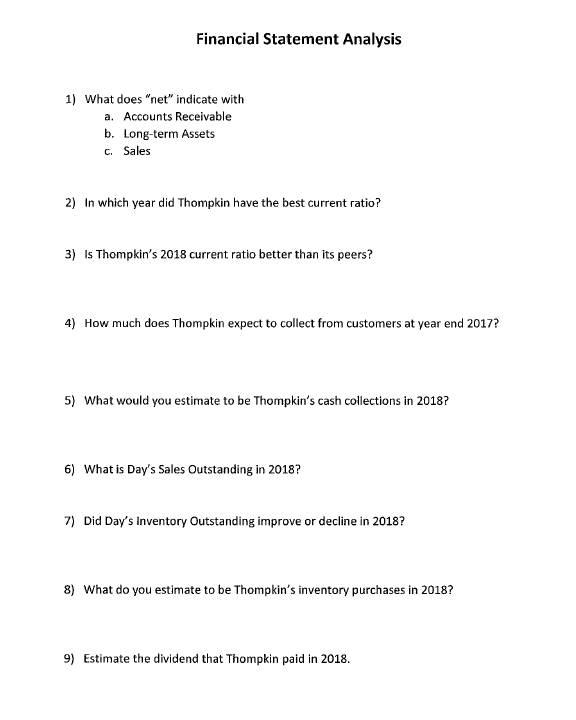
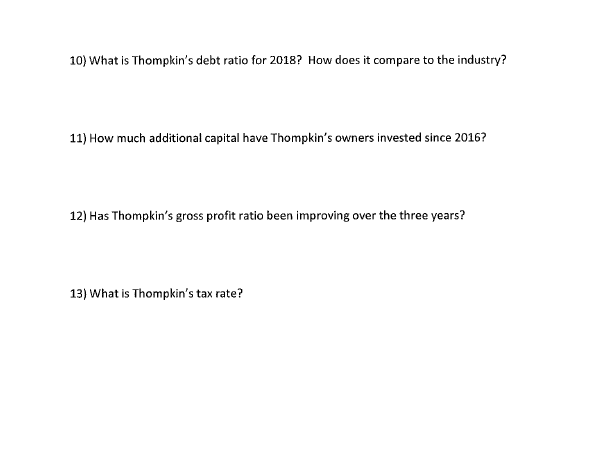
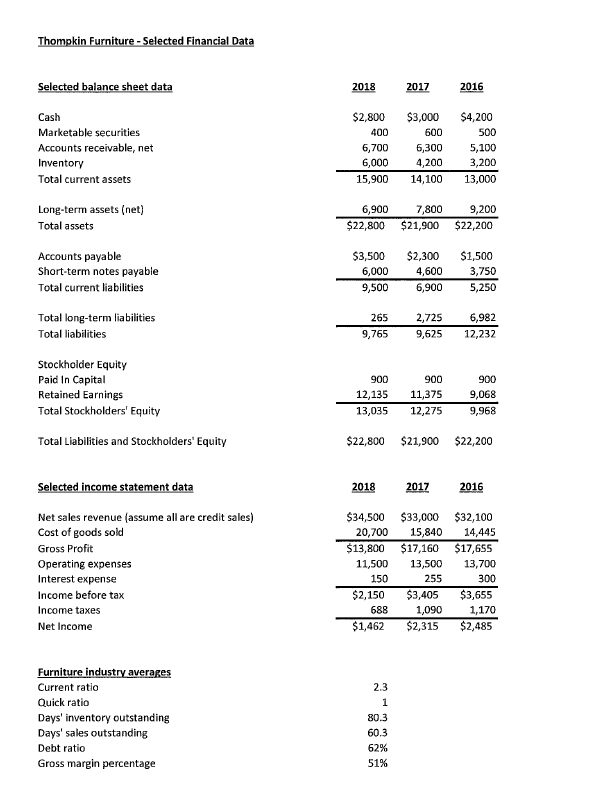
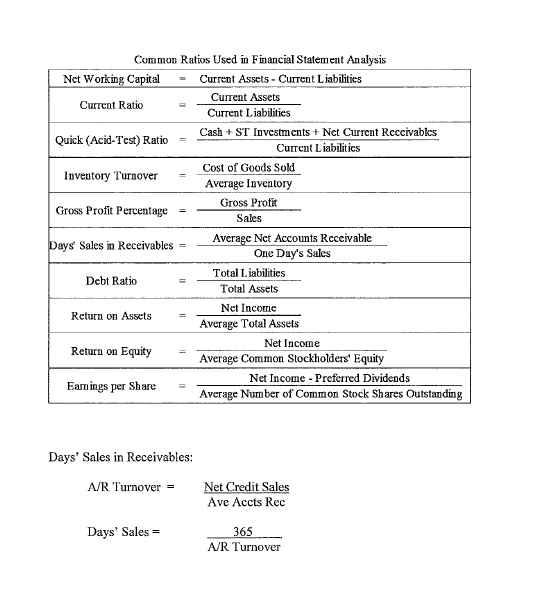
Financial Statement Analysis 1) What does "net" indicate with a. Accounts Receivable b. Long-term Assets C. Sales 2) In which year did Thompkin have the best current ratio? 3) Is Thompkin's 2018 current ratio better than its peers? 4) How much does Thompkin expect to collect from customers at year end 2017? 5) What would you estimate to be Thompkin's cash collections in 2018? 6) What is Day's Sales Outstanding in 2018? 7) Did Day's Inventory Outstanding improve or decline in 2018? 8) What do you estimate to be Thompkin's inventory purchases in 2018? 9) Estimate the dividend that Thompkin paid in 2018. 10) What is Thompkin's debt ratio for 2018? How does it compare to the industry? 11) How much additional capital have Thompkin's owners invested since 2016? 12) Has Thompkin's gross profit ratio been improving over the three years? 13) What is Thompkin's tax rate? Thompkin Furniture - Selected Financial Data Selected balance sheet data 2018 2017 2016 Cash Marketable securities Accounts receivable, net Inventory Total current assets $2,800 400 6,700 6,000 15,900 $3,000 600 6,300 4,200 14,100 $4,200 500 5,100 3,200 13,000 Long-term assets (net) Total assets 6,900 $22,800 7,800 $21,900 9,200 $22,200 Accounts payable Short-term notes payable Total current liabilities $3,500 6,000 9,500 $2,300 4,600 6,900 $1,500 3,750 5,250 Total long-term liabilities Total liabilities 265 9,765 2,725 9,625 6,982 12,232 Stockholder Equity Paid In Capital Retained Earnings Total Stockholders' Equity 900 12,135 13,035 900 11,375 12,275 900 9,068 9,968 Total Liabilities and Stockholders' Equity $22,800 $21,900 $22,200 Selected income statement data 2018 2017 2016 Net sales revenue (assume all are credit sales) Cost of goods sold Gross Profit Operating expenses Interest expense Income before tax Income taxes Net Income $34,500 $33,000 $32,100 20,700 15,840 14,445 $13,800 $17,160 $17,655 11,500 13,500 13,700 150 255 300 $2,150 $3,405 $3,655 688 1,090 1,170 $1,462 $2,315 $2,485 Furniture industry averages Current ratio Quick ratio Days' inventory outstanding Days' sales outstanding Debt ratio Gross margin percentage 2.3 1 80.3 60.3 62% 51% Common Ratios Used in Financial Statement Analysis Net Working Capital Current Assets - Current Liabilitics Current Assets Current Ratio Current Liabilities Quick (Acid-Test) Ratio Cash + ST Investments + Net Current Receivables Current Liabilitics Inventory Turnover Cost of Goods Sold Average Inventory Gross Profit Percentage Gross Profit Sales Days' Sales in Receivables = Average Nct Accounts Receivable One Day's Sales Total Liabilities Debt Ratio Total Assets Return on Assets Net Income Average Total Assets Return on Equity Net Income Average Common Stockholders' Equity Earings per Share Net Income - Preferred Dividends Average Number of Common Stock Shares Outstanding Days' Sales in Receivables: A/R Turnover = Net Credit Sales Ave Accts Rec Days' Sales 365 A/R Turnover