Answered step by step
Verified Expert Solution
Question
1 Approved Answer
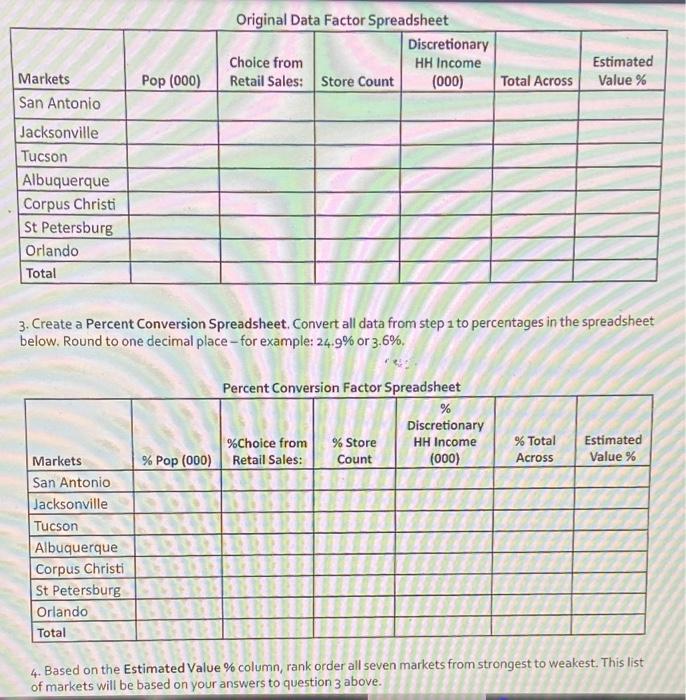
Could someone fill out these tables( in the third picture) and explain steps how it was done so for my better understanding. I am so
Could someone fill out these tables( in the third picture) and explain steps how it was done so for my better understanding. I am so lost. Thank you 


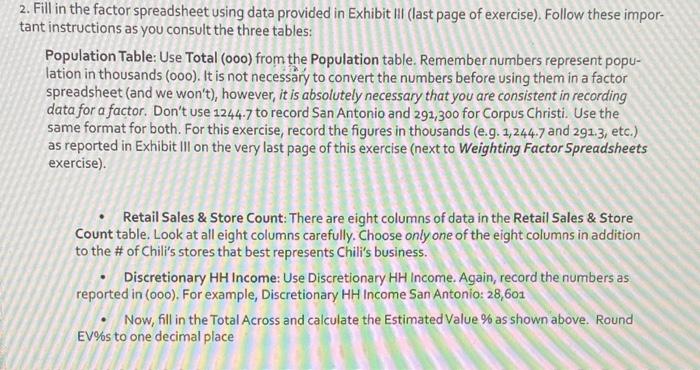
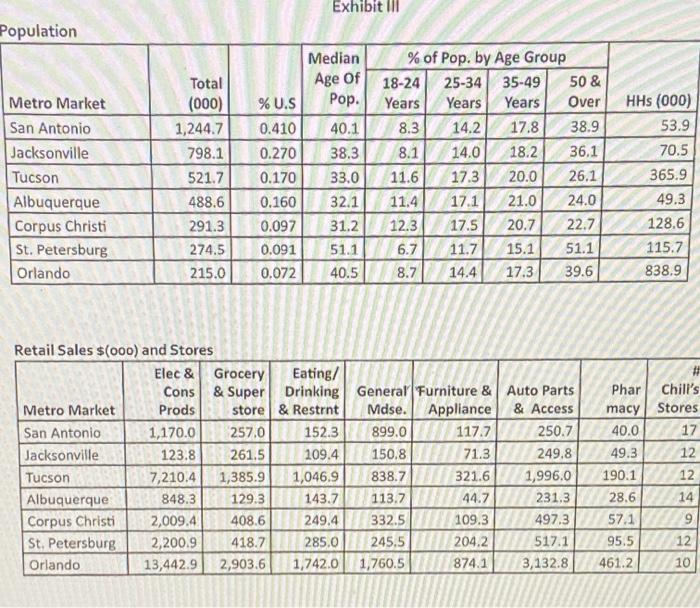
2. Fill in the factor spreadsheet using data provided in Exhibit III (last page of exercise). Follow these impor- tant instructions as you consult the three tables: Population Table: Use Total (000) from the population table. Remember numbers represent popu- lation in thousands (000). It is not necessary to convert the numbers before using them in a factor spreadsheet (and we won't), however, it is absolutely necessary that you are consistent in recording data for a factor. Don't use 1244.7 to record San Antonio and 291,300 for Corpus Christi. Use the same format for both. For this exercise, record the figures in thousands (e.g. 1,244.7 and 291.3, etc.) as reported in Exhibit III on the very last page of this exercise (next to Weighting Factor Spreadsheets exercise). Retail Sales & Store Count: There are eight columns of data in the Retail Sales & Store Count table. Look at all eight columns carefully. Choose only one of the eight columns in addition to the # of Chili's stores that best represents Chili's business. Discretionary HH Income: Use Discretionary HH Income. Again, record the numbers as reported in (ooo). For example, Discretionary HH Income San Antonio: 28,601 Now, fill in the Total Across and calculate the Estimated Value % as shown above. Round EV%s to one decimal place Exhibit III Population Metro Market San Antonio Jacksonville Tucson Albuquerque Corpus Christi St. Petersburg Orlando Total (000) 1,244.7 798.1 521.7 488.6 291.3 274.5 215.0 % U.S 0.410 0.270 0.170 0.160 0.097 0.091 0.072 Median Age Of Pop. 40.1 38.3 33.0 32.1 31.2 51.1 40.5 % of Pop. by Age Group 18-24 25-34 35-49 50 & Years Years Years Over 8.3 14.2 17.8 38.9 8.1 14.0 18.2 36.1 11.6 17.3 20.0 26.1 17.1 21.0 24.0 12.3 17.5 20.7 22.7 6.7 11.7 15.1 51.1 8.7 14.4 17.3 39.6 HHS (000) 53.9 70.5 365.9 49.3 128.6 115.7 838.9 11.4 Retail Sales $(000) and Stores Elec & Grocery Eating/ # Cons & Super Drinking General Furniture & Auto Parts Phar Chill's Metro Market Prods store & Restrnt Mdse. Appliance & Access macy Stores San Antonio 1,170.0 257.0 152.3 899.0 117.7 250.7 40.0 17 Jacksonville 123.8 261.5 109.4 150.8 71.3 249.8 49.3 12 Tucson 7,210.4 1,385.9 1,046.9 838.7 321.6 1,996.0 190.1 12 Albuquerque 848.3 129.3 143.7 113.7 44.7 231.3 28.6 14 Corpus Christi 2,009.4 408.6 249.4 332.5 109.3 497.3 57,1 9 St. Petersburg 2,200.9 418.7 285.0 245.5 204.2 517.195.5 12 Orlando 13,442.9 2,903.6 1,742.0 1,760.5 874.13,132.8 461.2 10 Original Data Factor Spreadsheet Discretionary Choice from HH Income Retail Sales: Store Count (000) Estimated Value % Pop (000) Total Across Markets San Antonio Jacksonville Tucson Albuquerque Corpus Christi St Petersburg Orlando Total 3. Create a Percent Conversion Spreadsheet. Convert all data from step 1 to percentages in the spreadsheet below. Round to one decimal place --for example: 24.9% or 3.6%, Percent Conversion Factor Spreadsheet % Discretionary %Choice from HH Income Retail Sales: Count (000) % Store % Total Across Estimated Value % % Pop (000) Markets San Antonio Jacksonville Tucson Albuquerque Corpus Christi St Petersburg Orlando Total 4. Based on the Estimated Value % column, rank order all seven markets from strongest to weakest. This list of markets will be based on your answers to question 3 above. 2. Fill in the factor spreadsheet using data provided in Exhibit III (last page of exercise). Follow these impor- tant instructions as you consult the three tables: Population Table: Use Total (000) from the population table. Remember numbers represent popu- lation in thousands (000). It is not necessary to convert the numbers before using them in a factor spreadsheet (and we won't), however, it is absolutely necessary that you are consistent in recording data for a factor. Don't use 1244.7 to record San Antonio and 291,300 for Corpus Christi. Use the same format for both. For this exercise, record the figures in thousands (e.g. 1,244.7 and 291.3, etc.) as reported in Exhibit III on the very last page of this exercise (next to Weighting Factor Spreadsheets exercise). Retail Sales & Store Count: There are eight columns of data in the Retail Sales & Store Count table. Look at all eight columns carefully. Choose only one of the eight columns in addition to the # of Chili's stores that best represents Chili's business. Discretionary HH Income: Use Discretionary HH Income. Again, record the numbers as reported in (ooo). For example, Discretionary HH Income San Antonio: 28,601 Now, fill in the Total Across and calculate the Estimated Value % as shown above. Round EV%s to one decimal place Exhibit III Population Metro Market San Antonio Jacksonville Tucson Albuquerque Corpus Christi St. Petersburg Orlando Total (000) 1,244.7 798.1 521.7 488.6 291.3 274.5 215.0 % U.S 0.410 0.270 0.170 0.160 0.097 0.091 0.072 Median Age Of Pop. 40.1 38.3 33.0 32.1 31.2 51.1 40.5 % of Pop. by Age Group 18-24 25-34 35-49 50 & Years Years Years Over 8.3 14.2 17.8 38.9 8.1 14.0 18.2 36.1 11.6 17.3 20.0 26.1 17.1 21.0 24.0 12.3 17.5 20.7 22.7 6.7 11.7 15.1 51.1 8.7 14.4 17.3 39.6 HHS (000) 53.9 70.5 365.9 49.3 128.6 115.7 838.9 11.4 Retail Sales $(000) and Stores Elec & Grocery Eating/ # Cons & Super Drinking General Furniture & Auto Parts Phar Chill's Metro Market Prods store & Restrnt Mdse. Appliance & Access macy Stores San Antonio 1,170.0 257.0 152.3 899.0 117.7 250.7 40.0 17 Jacksonville 123.8 261.5 109.4 150.8 71.3 249.8 49.3 12 Tucson 7,210.4 1,385.9 1,046.9 838.7 321.6 1,996.0 190.1 12 Albuquerque 848.3 129.3 143.7 113.7 44.7 231.3 28.6 14 Corpus Christi 2,009.4 408.6 249.4 332.5 109.3 497.3 57,1 9 St. Petersburg 2,200.9 418.7 285.0 245.5 204.2 517.195.5 12 Orlando 13,442.9 2,903.6 1,742.0 1,760.5 874.13,132.8 461.2 10 Original Data Factor Spreadsheet Discretionary Choice from HH Income Retail Sales: Store Count (000) Estimated Value % Pop (000) Total Across Markets San Antonio Jacksonville Tucson Albuquerque Corpus Christi St Petersburg Orlando Total 3. Create a Percent Conversion Spreadsheet. Convert all data from step 1 to percentages in the spreadsheet below. Round to one decimal place --for example: 24.9% or 3.6%, Percent Conversion Factor Spreadsheet % Discretionary %Choice from HH Income Retail Sales: Count (000) % Store % Total Across Estimated Value % % Pop (000) Markets San Antonio Jacksonville Tucson Albuquerque Corpus Christi St Petersburg Orlando Total 4. Based on the Estimated Value % column, rank order all seven markets from strongest to weakest. This list of markets will be based on your answers to question 3 above 


Step by Step Solution
There are 3 Steps involved in it
Step: 1

Get Instant Access to Expert-Tailored Solutions
See step-by-step solutions with expert insights and AI powered tools for academic success
Step: 2

Step: 3

Ace Your Homework with AI
Get the answers you need in no time with our AI-driven, step-by-step assistance
Get Started


