Could someone help me with this assignment? I don't know the formulas for any of the cells. Please post the excel formulas if possible.
Thanks!
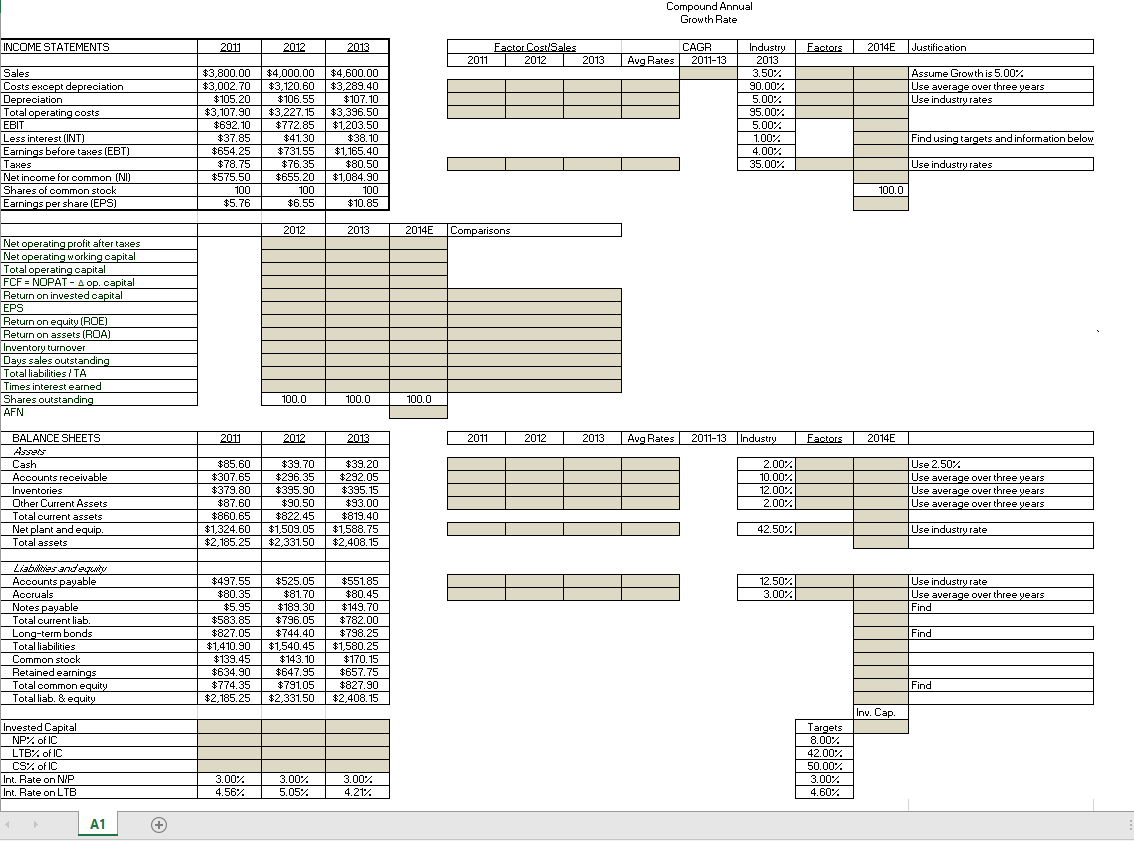
Compound Annual Growth Rate INCOME STATEMENTS 2011 2012 2013 Factors 2014 Justification Factor Cost/Sales 2011 2012 2013 Avg Rates CAGR 2011-13 Assume Growth is 5.00% Use average over three years Use industry rates Sales Costs except depreciation Depreciation Total operating costs EBIT Less interest (INT) Earnings before taxes (EBT) Taxes Net income for common INI Shares of common stock Earnings per share (EPS) $3,800.00 $3,002.70 $105.20 $3,107.90 $692.10 $37.85 $654.25 $78.75 $575 50 100 $5.76 $4,000.00 $3,120.60 $106.55 $3,227.15 $772.85 $41.30 $731.55 $76.35 655 20 100 $6.55 $4,600.00 $3,289.40 $107.10 $3,396.50 $1,203.50 $38.10 $1,165.40 $80.50 $1 084 90 100 $10.85 Industry 2013 3.50% 90.00% 5.00% 95.00% 5.00% 100% 4.00% 35.00% Find using targets and information below Use industry rates 100.0 T 2012 2013 2014 Comparisons Net operating profit after taxes Net operating working capital Total operating capital FCF = NOPAT-A op. capital Return on invested capital EPS Return on equity (ROE) Return on assets (ROA) Inventory turnover Days sales outstanding Total liabilities / TA Times interest earned Shares outstanding AFN | 100.0 100.0 100.0 2011 2012 2013 2011 2012 2013 Avg Rates 2011-13 Industry Factors 2014 BALANCE SHEETS Ases Cash Accounts receivable Inventories Other Current Assets Total current assets Net plant and equip. Total assets $85.60 $307.65 $379.80 $87 60 $860.65 $1,324.60 $2,185.25 $39.70 $296.35 $395.90 $90.50 $822.45 $1,509.05 $2,331.50 $39.20 $292.05 $395.15 $93 00 $819.40 $1,588.75 $2,408.15 2.00% 10.007 12.00% 2.00% Use 2.50% Use average over three years Use average over three years Use average over three years *SCO SO 1919.40 1 42.507 Use industry rate Use industry rate Use average over three years Find Liables and's Accounts payable Accruals Notes payable Total current liab. Long-term bonds Total liabilities Common stock Find $497.55 $80 35 $5.95 $583.85 $827.05 $1,410.90 $139.45 $634.90 $774.35 $2,185.25 $525.05 $81 70 $189.30 $796.05 $744.40 $1,540.45 $143.10 $647.95 $79105 $2,331.50 $551.85 $80 45 $149.70 $782.00 $798.25 $1,580.25 $170.15 $657.75 $827.90 $2,408.15 Find Total common equity Total liab. & equity Inv. Cap. Invested Capital NP% of IC TRX of IC CS% of IC Int. Rate on NIP Int. Rate on LTB Targets 8.00% 42.00% 50.00% 3.00% 4.60%. 3.00% 4.56%. 3.00% 5.05% 3.00% 4.21% I | Compound Annual Growth Rate INCOME STATEMENTS 2011 2012 2013 Factors 2014 Justification Factor Cost/Sales 2011 2012 2013 Avg Rates CAGR 2011-13 Assume Growth is 5.00% Use average over three years Use industry rates Sales Costs except depreciation Depreciation Total operating costs EBIT Less interest (INT) Earnings before taxes (EBT) Taxes Net income for common INI Shares of common stock Earnings per share (EPS) $3,800.00 $3,002.70 $105.20 $3,107.90 $692.10 $37.85 $654.25 $78.75 $575 50 100 $5.76 $4,000.00 $3,120.60 $106.55 $3,227.15 $772.85 $41.30 $731.55 $76.35 655 20 100 $6.55 $4,600.00 $3,289.40 $107.10 $3,396.50 $1,203.50 $38.10 $1,165.40 $80.50 $1 084 90 100 $10.85 Industry 2013 3.50% 90.00% 5.00% 95.00% 5.00% 100% 4.00% 35.00% Find using targets and information below Use industry rates 100.0 T 2012 2013 2014 Comparisons Net operating profit after taxes Net operating working capital Total operating capital FCF = NOPAT-A op. capital Return on invested capital EPS Return on equity (ROE) Return on assets (ROA) Inventory turnover Days sales outstanding Total liabilities / TA Times interest earned Shares outstanding AFN | 100.0 100.0 100.0 2011 2012 2013 2011 2012 2013 Avg Rates 2011-13 Industry Factors 2014 BALANCE SHEETS Ases Cash Accounts receivable Inventories Other Current Assets Total current assets Net plant and equip. Total assets $85.60 $307.65 $379.80 $87 60 $860.65 $1,324.60 $2,185.25 $39.70 $296.35 $395.90 $90.50 $822.45 $1,509.05 $2,331.50 $39.20 $292.05 $395.15 $93 00 $819.40 $1,588.75 $2,408.15 2.00% 10.007 12.00% 2.00% Use 2.50% Use average over three years Use average over three years Use average over three years *SCO SO 1919.40 1 42.507 Use industry rate Use industry rate Use average over three years Find Liables and's Accounts payable Accruals Notes payable Total current liab. Long-term bonds Total liabilities Common stock Find $497.55 $80 35 $5.95 $583.85 $827.05 $1,410.90 $139.45 $634.90 $774.35 $2,185.25 $525.05 $81 70 $189.30 $796.05 $744.40 $1,540.45 $143.10 $647.95 $79105 $2,331.50 $551.85 $80 45 $149.70 $782.00 $798.25 $1,580.25 $170.15 $657.75 $827.90 $2,408.15 Find Total common equity Total liab. & equity Inv. Cap. Invested Capital NP% of IC TRX of IC CS% of IC Int. Rate on NIP Int. Rate on LTB Targets 8.00% 42.00% 50.00% 3.00% 4.60%. 3.00% 4.56%. 3.00% 5.05% 3.00% 4.21% I |