Could someone please help me with these numbers and possibly how to get them
Selected comparative financial statements of Haroun Company follow.
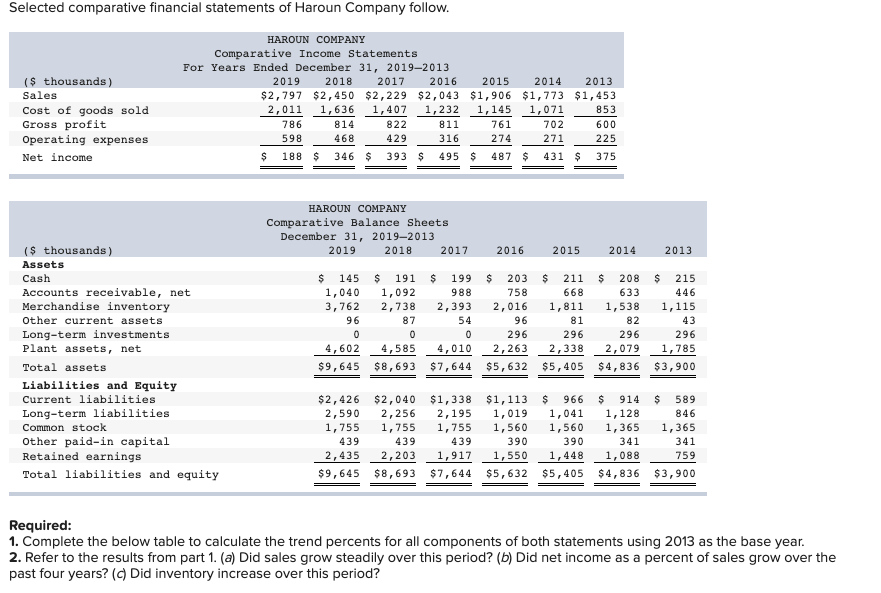
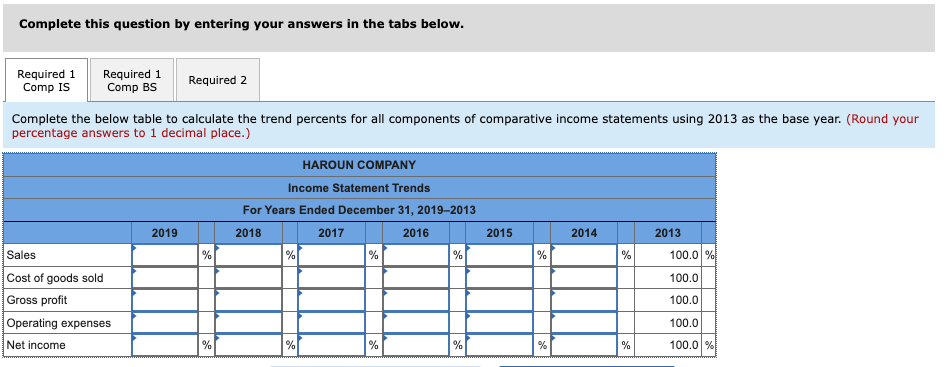
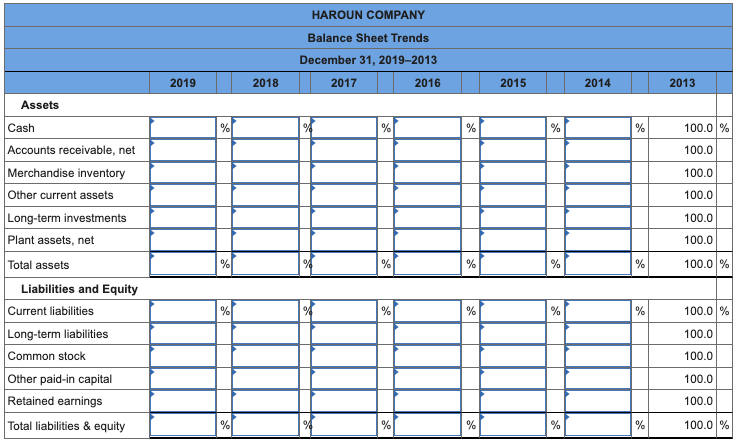
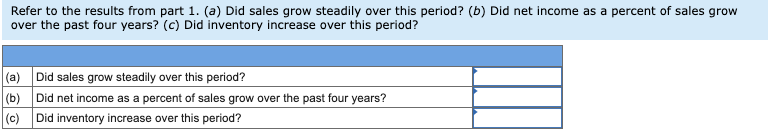
Selected comparative financial statements of Haroun Company follow. (s thousands) Sales Cost of goods sold Gross profit Operating expenses Net income HAROUN COMPANY Comparative Income Statements For Years Ended December 31, 2019-2013 2019 2018 2017 2016 2015 2014 2013 $2,797 $2,450 $2,229 $2,043 $1,906 $1,773 $1,453 2,011 1,636 1,407 1,232 1,145 1,071 853 786 814 822 811 761 702 600 598 468 429 316 274 271 225 $ 188 $ 346 $ 393 $ 495 $ 487 $ 431 $ 375 HAROUN COMPANY Comparative Balance Sheets December 31, 2019-2013 2019 2018 2017 2016 2015 2014 2013 $ $ $ ($ thousands) Assets Cash Accounts receivable, net Merchandise inventory Other current assets Long-term investments Plant assets, net Total assets Liabilities and Equity Current liabilities Long-term liabilities Common stock Other paid-in capital Retained earnings Total liabilities and equity $ 145 1,040 3,762 96 0 4,602 $9,645 $ 191 $ 199 1,092 988 2,738 2,393 87 54 0 0 4,585 4,010 $8,693 $7,644 $ 203 758 2,016 96 296 2,263 $5,632 $ 211 668 1,811 81 296 2,338 $5,405 $ 208 $ 215 633 446 1,538 1,115 82 43 296 296 2,079 1,785 $4,836 $3,900 $2,426 2,590 1,755 439 2,435 $9,645 $2,040 2,256 1,755 439 2, 203 $8,693 $1,338 2,195 1,755 439 1,917 $7,644 $1,113 1,019 1,560 390 1,550 $5,632 $ 966 1,041 1,560 390 1,448 $5,405 $ 914 $ 589 1,128 846 1,365 1,365 341 341 1,088 759 $4,836 $3,900 Required: 1. Complete the below table to calculate the trend percents for all components of both statements using 2013 as the base year. 2. Refer to the results from part 1. (a) Did sales grow steadily over this period? (b) Did net income as a percent of sales grow over the past four years? (Did inventory increase over this period? Complete this question by entering your answers in the tabs below. Required 1 Comp IS Required 1 Comp BS Required 2 Complete the below table to calculate the trend percents for all components of comparative income statements using 2013 as the base year. (Round your percentage answers to 1 decimal place.) HAROUN COMPANY Income Statement Trends For Years Ended December 31, 2019-2013 2018 2017 2016 2019 2015 2014 2013 Sales % % % % % % 100.0 % 100.0 100.0 Cost of goods sold Gross profit Operating expenses Net income 100.0 % % % % % % 100.0 % HAROUN COMPANY Balance Sheet Trends December 31, 2019-2013 2019 2018 2017 2016 2015 2014 2013 % % % % % 100.0 % 100.0 100.0 100.0 100.0 Assets Cash Accounts receivable, net Merchandise inventory Other current assets Long-term investments Plant assets, net Total assets Liabilities and Equity Current liabilities Long-term liabilities Common stock Other paid-in capital Retained earnings Total liabilities & equity 100.0 100.0 % % % % % % % % % % % 100.0 % 100.0 100.0 100.0 100.0 % % % % % 100.0 % Refer to the results from part 1. (a) Did sales grow steadily over this period? (6) Did net income as a percent of sales grow over the past four years?' (c) Did inventory increase over this period?' (a) Did sales grow steadily over this period? (b) Did net income as a percent of sales grow over the past four years? (c) Did inventory increase over this period