could someone please tell me and help me to understand this problems below?
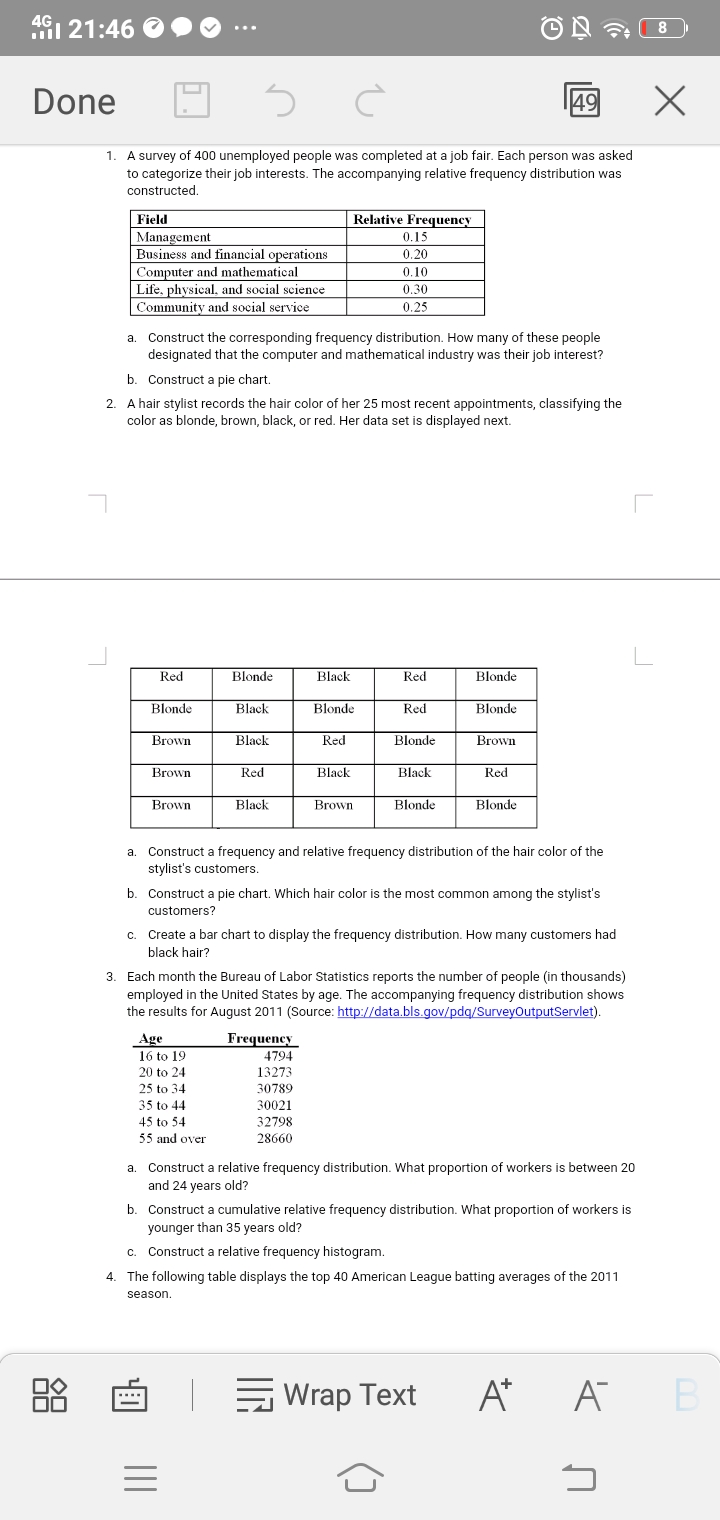
1 21:46 7 90 ... Done D C 49 X 1. A survey of 400 unemployed people was completed at a job fair. Each person was asked to categorize their job interests. The accompanying relative frequency distribution was constructed. Field Relative Frequency Management 0.15 Business and financial operations 0,20 Computer and mathematical 0.10 Life, physical, and social science 0.30 Community and social service 0.25 a. Construct the corresponding frequency distribution. How many of these people designated that the computer and mathematical industry was their job interest? b. Construct a pie chart. 2. A hair stylist records the hair color of her 25 most recent appointments, classifying the color as blonde, brown, black, or red. Her data set is displayed next. Red Blonde Black Red Blonde Blonde Black Blonde Red Blonde Brown Black Red Blonde Brown Brown Red Black Black Red Brown Black Brown Blonde Blonde a. Construct a frequency and relative frequency distribution of the hair color of the stylist's customers. b. Construct a pie chart. Which hair color is the most common among the stylist's customers? c. Create a bar chart to display the frequency distribution. How many customers had black hair? 3. Each month the Bureau of Labor Statistics reports the number of people (in thousands) employed in the United States by age. The accompanying frequency distribution shows the results for August 2011 (Source: http://data.bls.gov/pdq/SurveyOutputServlet). Age Frequency 16 to 19 4794 20 to 24 13273 25 to 34 30789 35 to 44 30021 45 to 54 32798 55 and over 28660 a. Construct a relative frequency distribution. What proportion of workers is between 20 and 24 years old? b. Construct a cumulative relative frequency distribution. What proportion of workers is younger than 35 years old? c. Construct a relative frequency histogram. 4. The following table displays the top 40 American League batting averages of the 2011 season. Wrap Text A A B =