could somone please show and explain how to do this ?
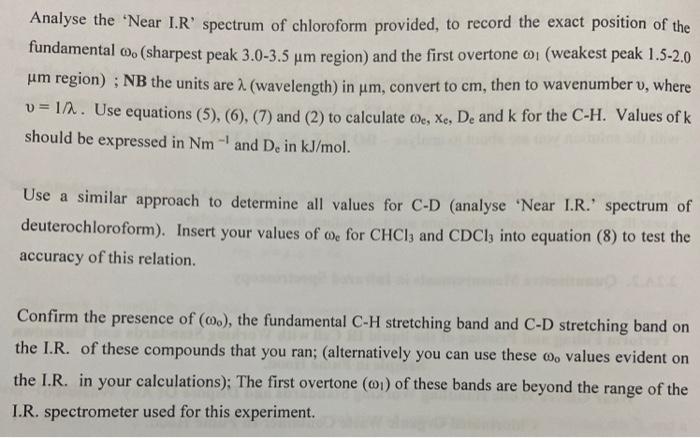
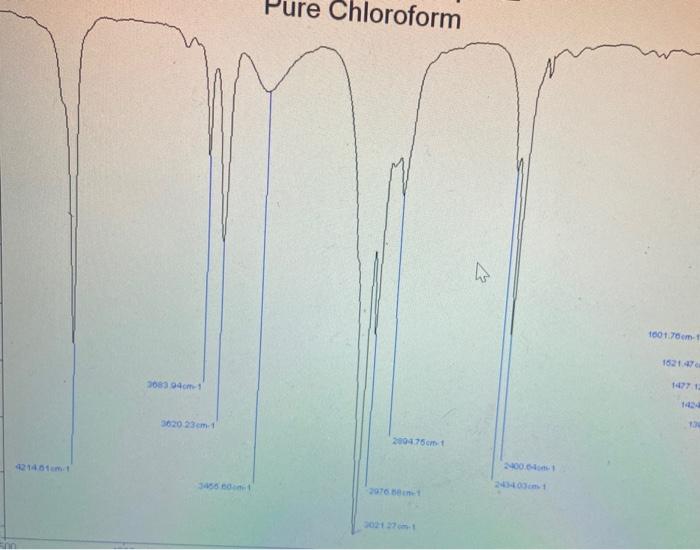
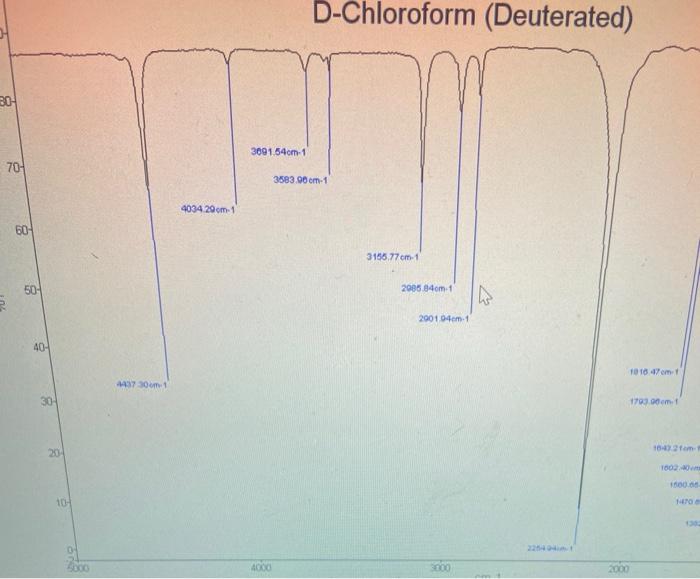
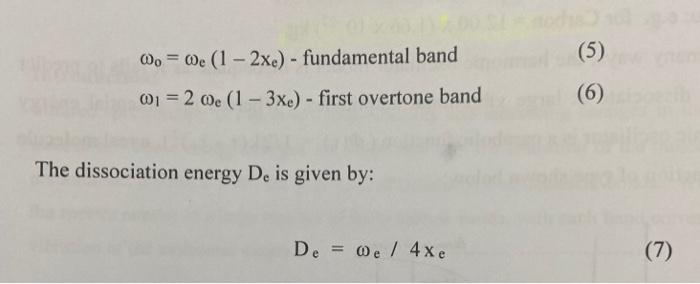
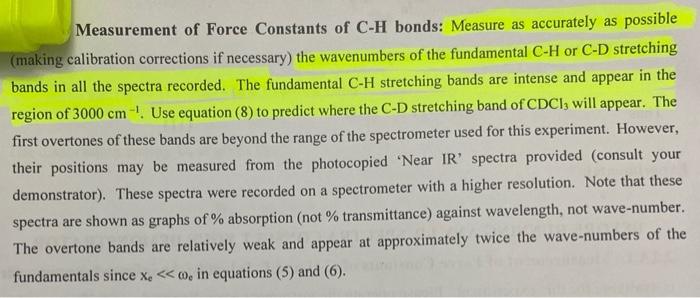
Analyse the 'Near I.R' spectrum of chloroform provided, to record the exact position of the fundamental 6. (sharpest peak 3.0-3.5 um region) and the first overtone or (weakest peak 1.5-2.0 um region) ; NB the units are 1 (wavelength) in um, convert to cm, then to wavenumber v, where v=11. Use equations (5), (6), (7) and (2) to calculate Oe, Xe, De and k for the C-H. Values of k should be expressed in Nm and D. in kJ/mol. Use a similar approach to determine all values for C-D (analyse 'Near I.R.' spectrum of deuterochloroform). Insert your values of me for CHCl3 and CDC1; into equation (8) to test the accuracy of this relation. Confirm the presence of (0.), the fundamental C-H stretching band and C-D stretching band on the I.R. of these compounds that you ran; (alternatively you can use these 0, values evident on the I.R. in your calculations): The first overtone (01) of these bands are beyond the range of the I.R. spectrometer used for this experiment. Pure Chloroform 2 1001.70 m 1521. 3083941 3620 23 cm 2094 75cm 2006 3550 sne D-Chloroform (Deuterated) 20 309164cm1 70- 3883.00 cm-1 4034 29 om 1 60 3158.77 cm. 1 50- 2086.84 om 1 IN 2001.04em1 40- 10 10.47 m. 4437301 30 1793.00m. 20 16:42 am 10020 10- TO 1000 2000 0o = 0 (1 - 2xe) - fundamental band (5) (6) 01 = 2 0e (1 - 3xe) - first overtone band The dissociation energy D. is given by: De = 0 / 4xe (7) 1 Vk/u 2 (2) Measurement of Force Constants of C-H bonds: Measure as accurately as possible (making calibration corrections if necessary) the wavenumbers of the fundamental C-H or C-D stretching bands in all the spectra recorded. The fundamental C-H stretching bands are intense and appear in the region of 3000 cm! Use equation (8) to predict where the C-D stretching band of CDCI, will appear. The first overtones of these bands are beyond the range of the spectrometer used for this experiment. However, their positions may be measured from the photocopied 'Near IR' spectra provided (consult your demonstrator). These spectra were recorded on a spectrometer with a higher resolution. Note that these spectra are shown as graphs of % absorption (not % transmittance) against wavelength, not wave-number. The overtone bands are relatively weak and appear at approximately twice the wave-numbers of the fundamentals since X.


