could you explain and solve these An insurance company finds that of 619 randomly selected auto accidents, teenagers were driving the vehicle in 118 of
could you explain and solve these
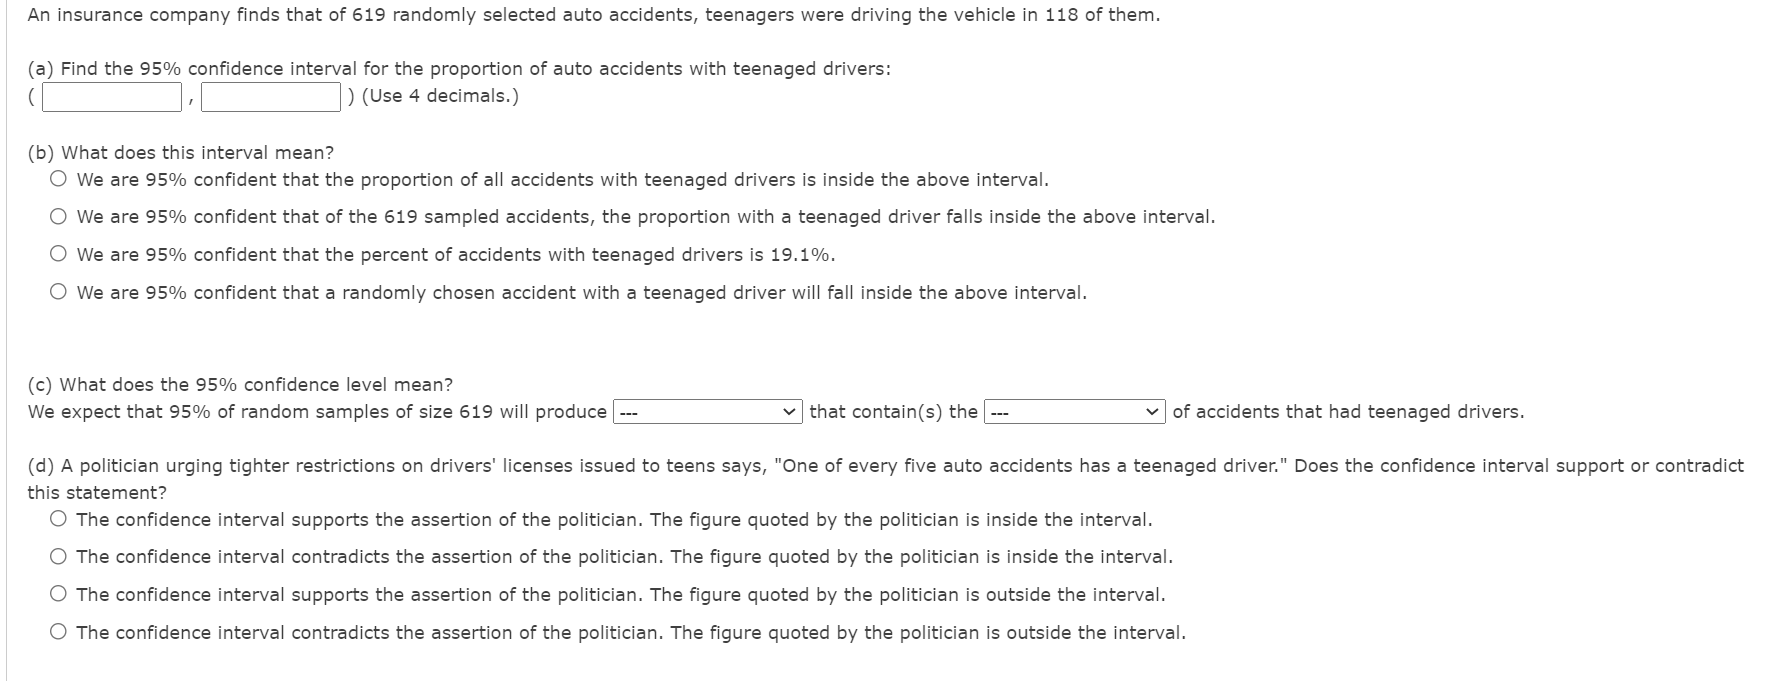
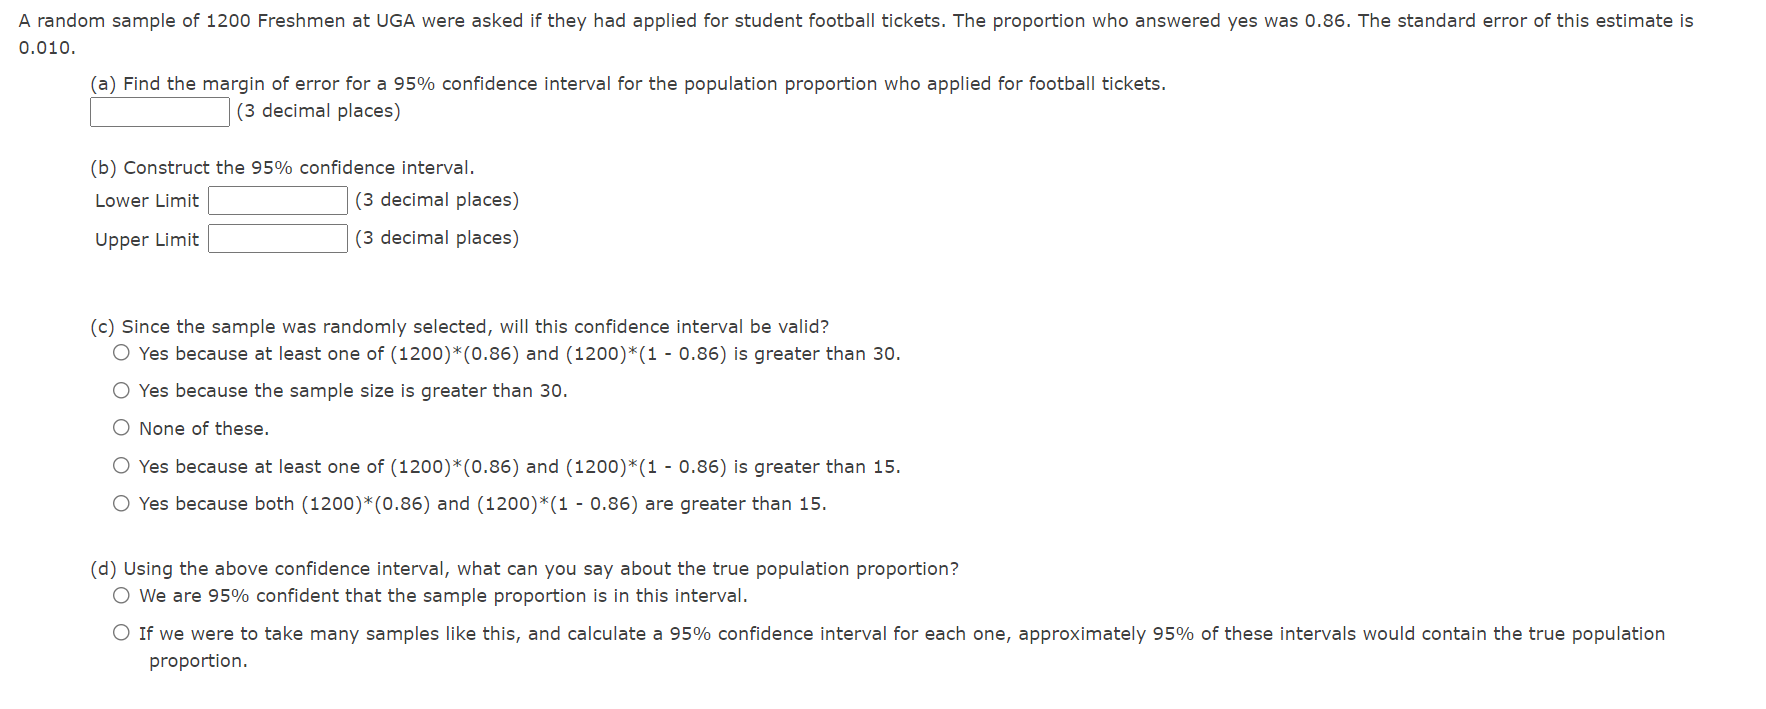
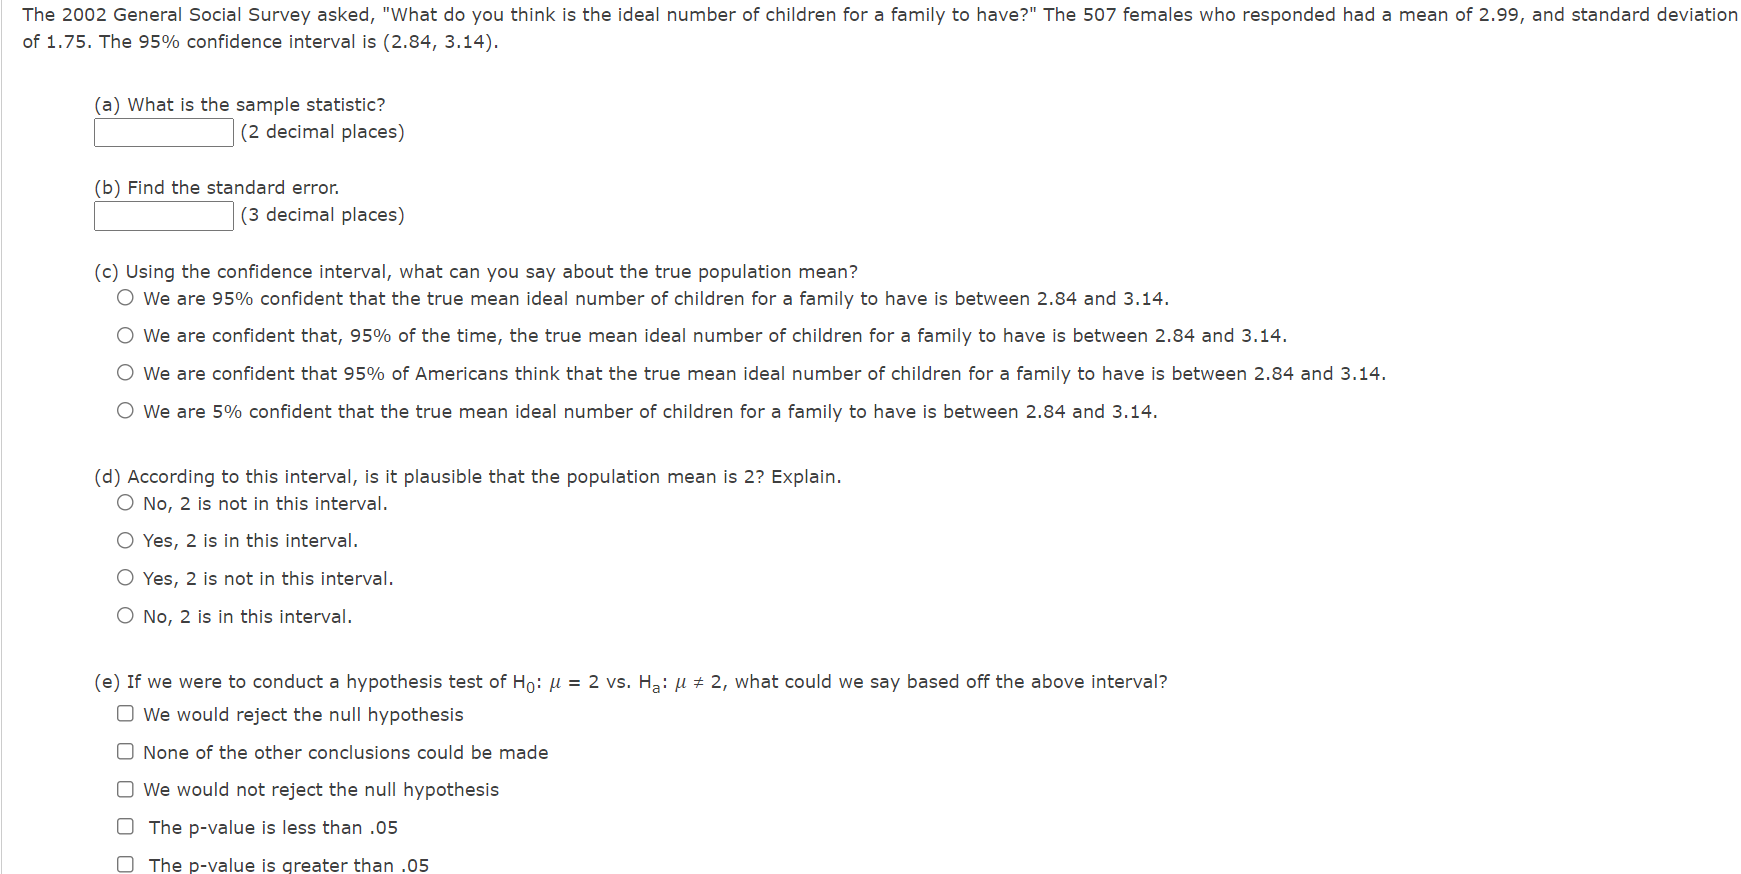
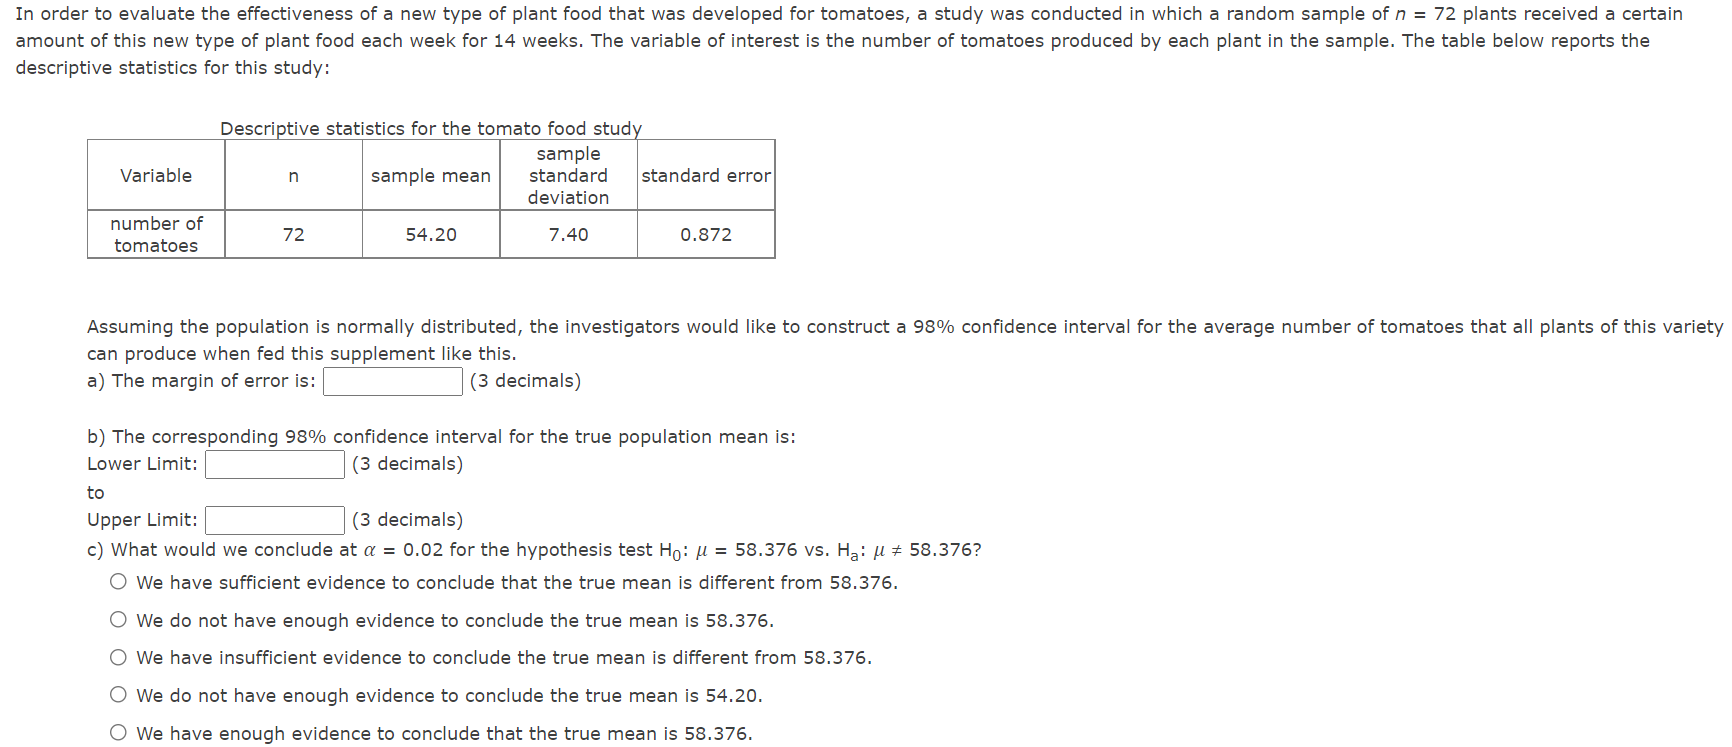
An insurance company finds that of 619 randomly selected auto accidents, teenagers were driving the vehicle in 118 of them. (a) Find the 95% confidence interval for the proportion of auto accidents with teenaged drivers: ) (Use 4 decimals.) (b) What does this interval mean? O We are 95% confident that the proportion of all accidents with teenaged drivers is inside the above interval. We are 95% confident that of the 619 sampled accidents, the proportion with a teenaged driver falls inside the above interval. O We are 95% confident that the percent of accidents with teenaged drivers is 19.1%. We are 95% confident that a randomly chosen accident with a teenaged driver will fall inside the above interval. (c) What does the 95% confidence level mean? We expect that 95% of random samples of size 619 will produce |--- that contain(s) the |--- of accidents that had teenaged drivers. (d) A politician urging tighter restrictions on drivers' licenses issued to teens says, "One of every five auto accidents has a teenaged driver." Does the confidence interval support or contradict this statement? The confidence interval supports the assertion of the politician. The figure quoted by the politician is inside the interval. O The confidence interval contradicts the assertion of the politician. The figure quoted by the politician is inside the interval. O The confidence interval supports the assertion of the politician. The figure quoted by the politician is outside the interval. The confidence interval contradicts the assertion of the politician. The figure quoted by the politician is outside the interval.A random sample of 1200 Freshmen at UGA were asked if they had applied for student football tickets. The proportion who answered yes was 0.36. The standard error of this estimate is 0.010. (a) Find the margin of error for a 95% condence interval for the population proportion who applied for football tickets. (3 decimal places) (b) Construct the 95% condence interval. Lower Limit I: (3 decimal places) Upper Limit I: (3 decimal places) (c) Since the sample was randomly selected, will this condence interval be valid? 0 Yes because at least one of (1200)*(0.86) and (1200)*(1 0.86) is greater than 30. 0 Yes because the sample size is greater than 30. 0 None of these. 0 Yes because at least one of (1200)*(0.86) and (1200)*(1 0.86) is greater than 15. 0 Yes because both (1200)*(0.86) and (1200)*(1 - 0.86) are greater than 15. (d) Using the above confidence interval, what can you say about the true population proportion? 0 We are 95% condent that the sample proportion is in this interval. 0 If we were to take many samples like this, and calculate a 95% condence interval for each one, approximately 95% of these intervals would contain the true population proportion. The 2002 General Social Survey asked, "What do you think is the ideal number of children for a family to have?" The 507 females who responded had a mean of 2.99, and standard deviation of 1.75. The 95% confidence interval is (2.34, 3.14). (a) What is the sample statistic? S (2 decimal places) (b) Find the standard error. E (3 decimal places) (c) Using the condence interval, what can you say about the true population mean? 0 We are 95% condent that the true mean ideal number of children for a family to have is between 2.84 and 3.14. 0 We are condent that, 95% of the time, the true mean ideal number of children for a family to have is between 2.84 and 3.14. C We are condent that 95% of Americans think that the true mean ideal number of children for a family to have is between 2.84 and 3.14. 0 We are 5% condent that the true mean ideal number of children for a family to have is between 2.84 and 3.14. (d) According to this interval, is it plausible that the population mean is 2? Explain. O No, 2 is not in this interval. 0 Yes, 2 is in this interval. 0 Yes, 2 is not in this interval. 0 No, 2 is in this interval. (e) If we were to conduct a hypothesis test of H0: [,1 = 2 vs. H3: [1 ;c 2, what could we say based off the above interval? D We would reject the null hypothesis Cl None of the other conclusions could be made D We would not reject the null hypothesis U The p-value is less than .05 Cl The D-value is Greater than .05 In order to evaluate the effectiveness of a new type of plant food that was developed for tomatoes, a study was conducted in which a random sample of n = 72 plants received a certain amount of this new type of plant food each week for 14 weeks. The variable of interest is the number of tomatoes produced by each plant in the sample. The table below reports the descriptive statistics for this study: Descriptive statistics for the tomato food stud sample Variable sample mean standard standard error deviation tomatoes Assuming the population is normally distributed, the investigators would like to construct a 98% condence interval for the average number of tomatoes that all plants of this variety can produce when fed this supplement like this. a) The margin of error is: I: (3 decimals) b) The corresponding 98% condence interval for the true population mean is: Lower Limit: \\:| (3 decimals) to Upper Limit: \\:| (3 decimals) c) What would we conclude at a = 0.02 for the hypothesis test H0: u = 58.376 vs. Ha: ,u #- 58.376? 0 We have sufcient evidence to conclude that the true mean is different from 58.376. 0 We do not have enough evidence to conclude the true mean is 58.376. C) We have insufficient evidence to conclude the true mean is different from 58.376. 0 We do not have enough evidence to conclude the true mean is 54.20. 0 We have enough evidence to conclude that the true mean is 58.376
Step by Step Solution
There are 3 Steps involved in it
Step: 1
Get Instant Access to Expert-Tailored Solutions
See step-by-step solutions with expert insights and AI powered tools for academic success
Step: 2
Step: 3
Ace Your Homework with AI
Get the answers you need in no time with our AI-driven, step-by-step assistance