

Answered step by step
Verified Expert Solution
Question
1 Approved Answer
Could you help me finish the top table? Case Assignment Question: Prepare a pro forma cash flow forecast with 0.50 per year dividend by completing
Could you help me finish the top table?
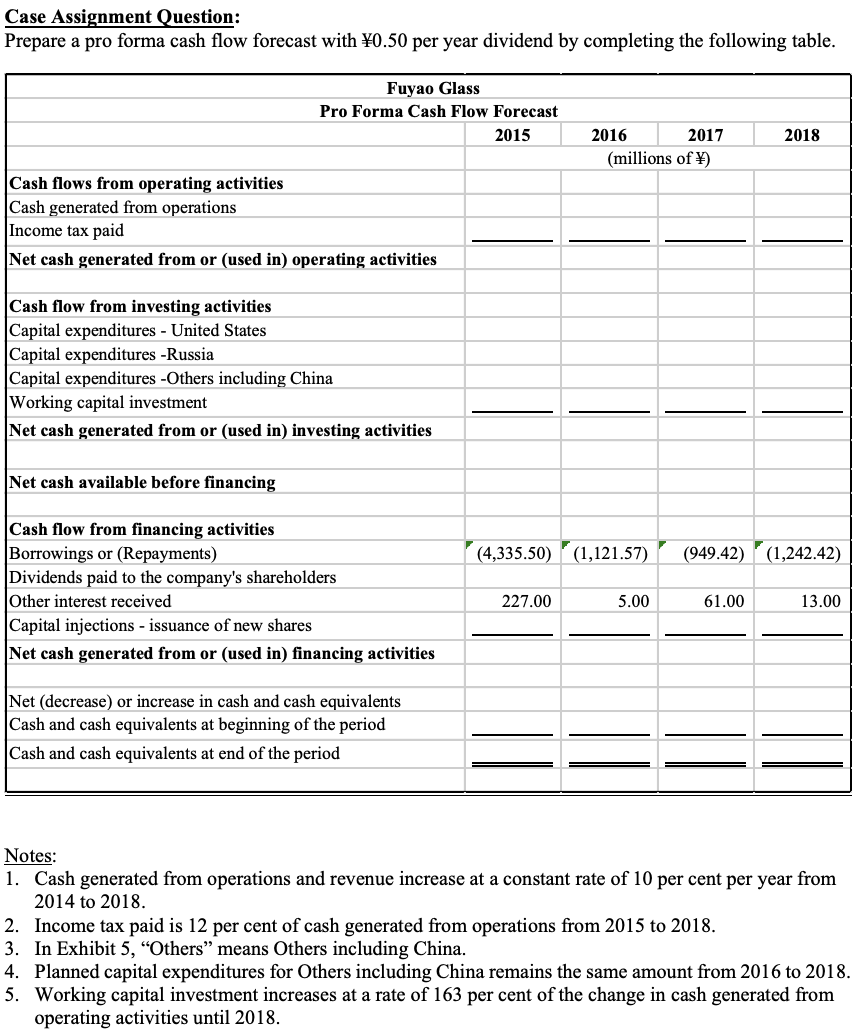
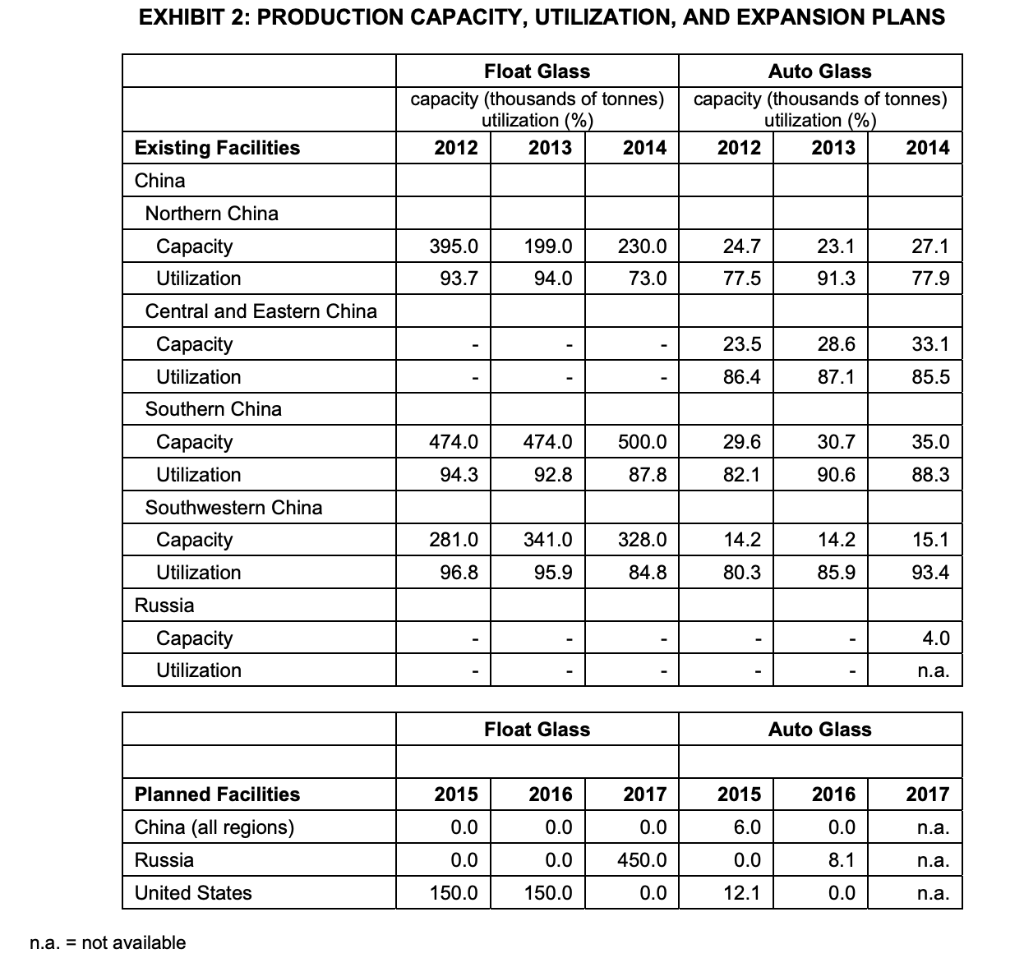
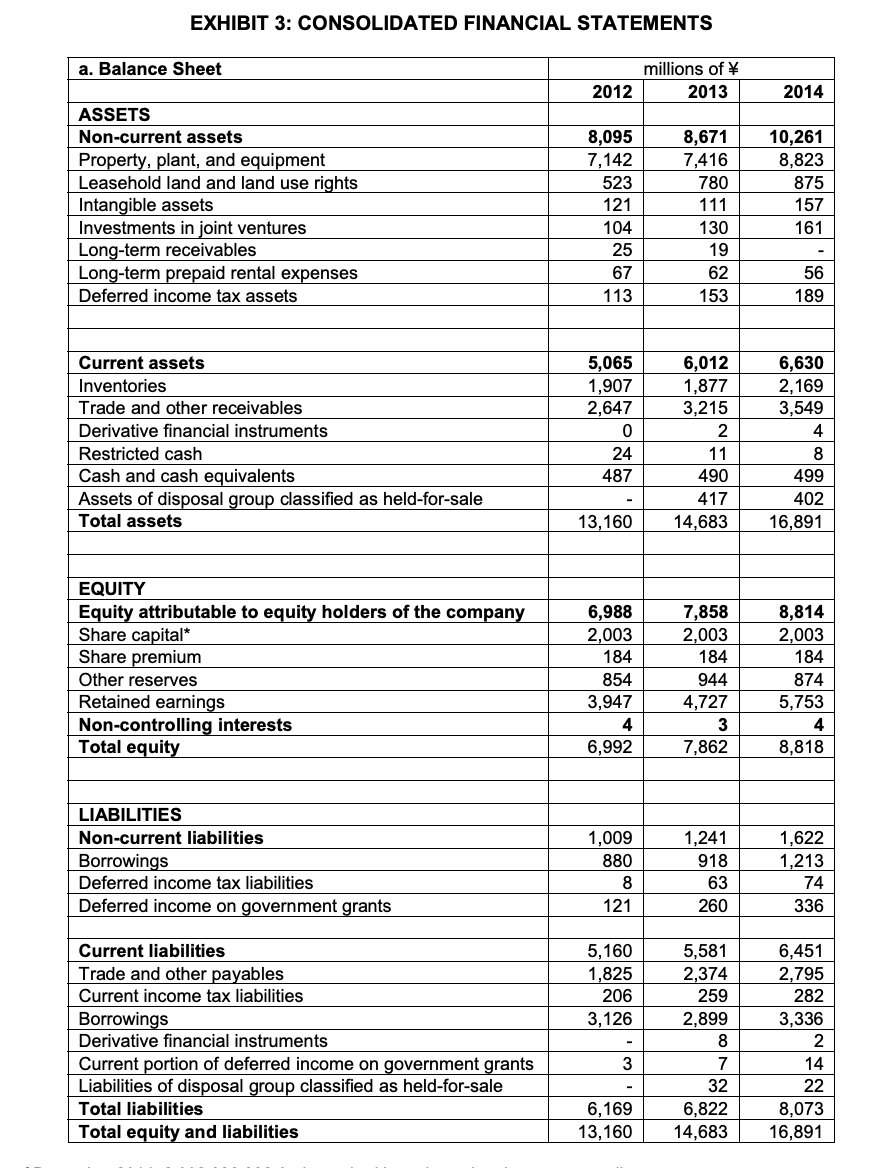
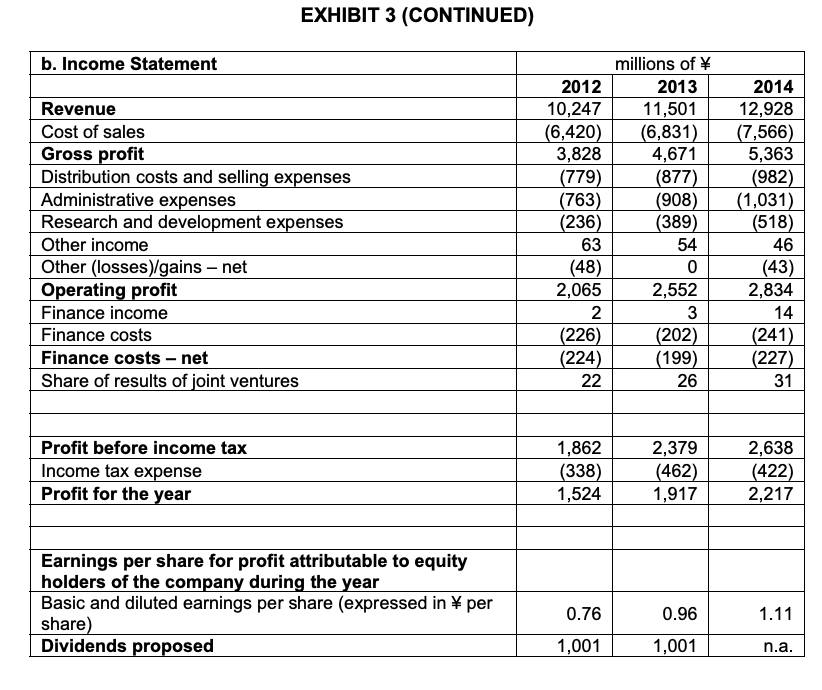
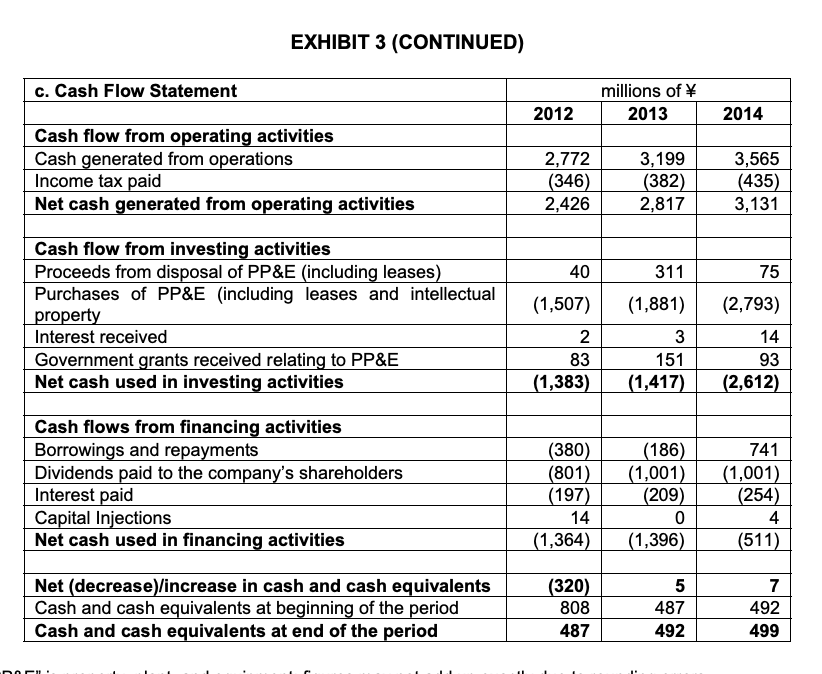
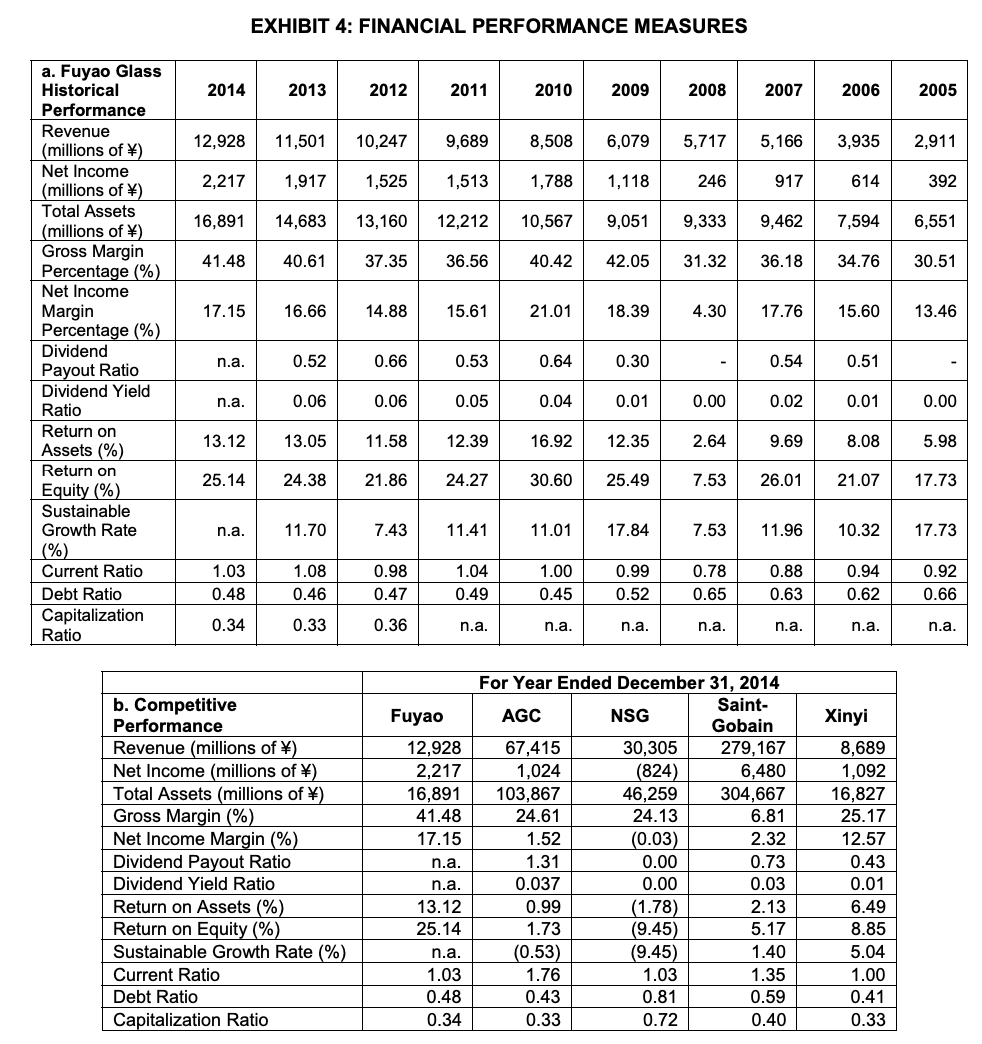
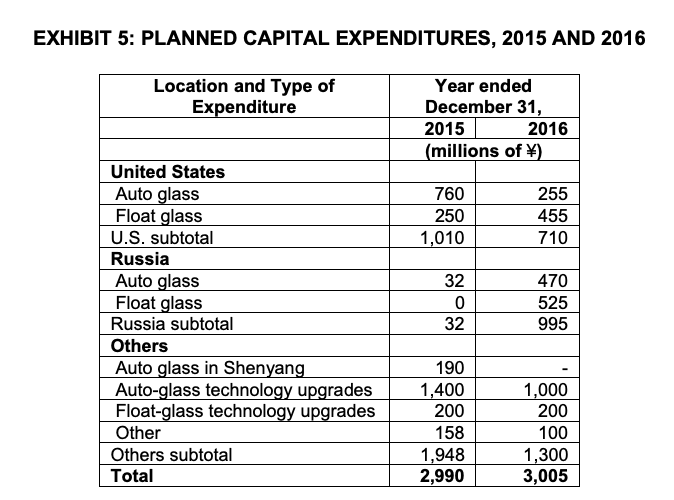
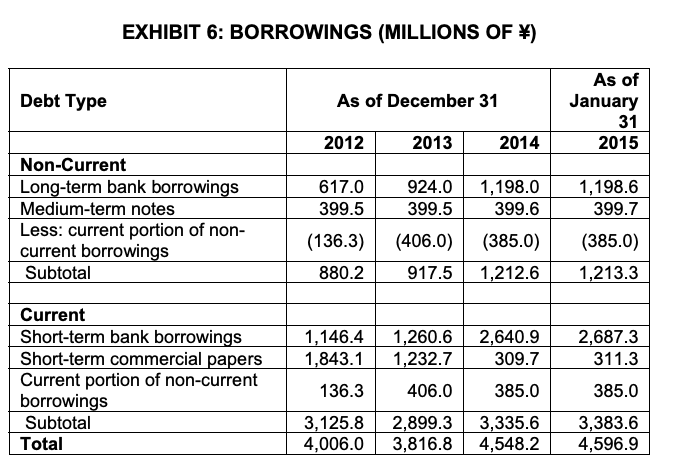
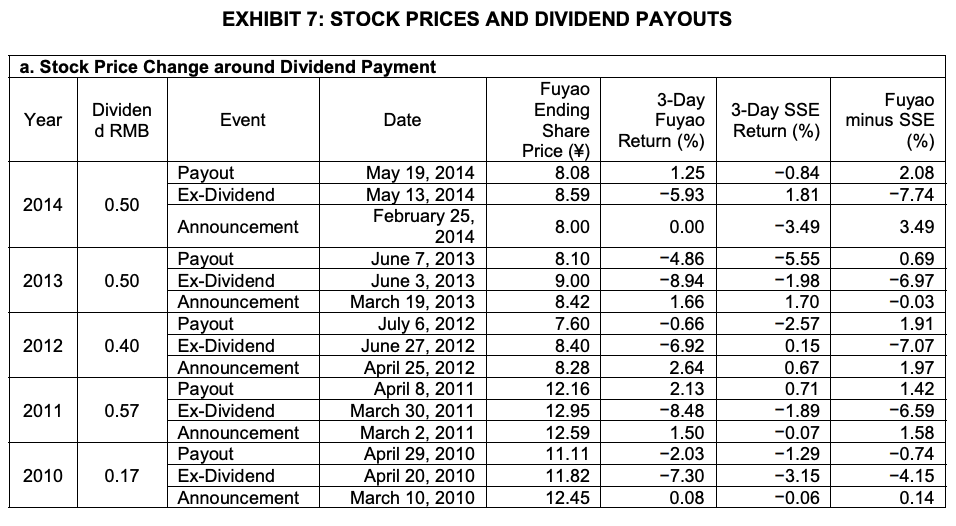
Case Assignment Question: Prepare a pro forma cash flow forecast with 0.50 per year dividend by completing the following table. Fuyao Glass Pro Forma Cash Flow Forecast 2015 2018 2016 2017 (millions of ) Cash flows from operating activities Cash generated from operations Income tax paid Net cash generated from or (used in) operating activities Cash flow from investing activities Capital expenditures - United States Capital expenditures - Russia Capital expenditures -Others including China Working capital investment Net cash generated from or (used in) investing activities Net cash available before financing (4,335.50) (1,121.57) (949.42) (1,242.42) Cash flow from financing activities Borrowings or (Repayments) Dividends paid to the company's shareholders Other interest received Capital injections - issuance of new shares |Net cash generated from or (used in) financing activities 227.00 5.00 61.00 13.00 Net (decrease) or increase in cash and cash equivalents Cash and cash equivalents at beginning of the period Cash and cash equivalents at end of the period Notes: 1. Cash generated from operations and revenue increase at a constant rate of 10 per cent per year from 2014 to 2018. 2. Income tax paid is 12 per cent of cash generated from operations from 2015 to 2018. 3. In Exhibit 5, "Others" means Others including China. 4. Planned capital expenditures for Others including China remains the same amount from 2016 to 2018. 5. Working capital investment increases at a rate of 163 per cent of the change in cash generated from operating activities until 2018. EXHIBIT 2: PRODUCTION CAPACITY, UTILIZATION, AND EXPANSION PLANS Float Glass capacity (thousands of tonnes) utilization (%) 2012 2013 2014 Auto Glass capacity (thousands of tonnes) utilization (%) 2012 2013 2014 395.0 93.7 199.0 94.0 230.0 73.0 24.7 77.5 23.1 91.3 27.1 77.9 33.1 23.5 86.4 28.6 87.1 85.5 Existing Facilities China Northern China Capacity Utilization Central and Eastern China Capacity Utilization Southern China Capacity Utilization Southwestern China Capacity Utilization Russia Capacity Utilization 35.0 474.0 94.3 474.0 92.8 500.0 87.8 29.6 82.1 30.7 90.6 88.3 15.1 281.0 96.8 341.0 95.9 328.0 84.8 14.2 80.3 14.2 85.9 93.4 4.0 n.a. Float Glass Auto Glass 2017 n.a. Planned Facilities China (all regions) Russia United States 2015 0.0 0.0 150.0 2016 0.0 0.0 150.0 2017 2015 0.0 16.0 450.0 0.0 0.0 - 12.1 2016 0.0 8.1 0.0 n.a. n.a. n.a. = not available EXHIBIT 3: CONSOLIDATED FINANCIAL STATEMENTS a. Balance Sheet millions of 2012 2013 2014 ASSETS Non-current assets Property, plant, and equipment Leasehold land and land use rights | Intangible assets Investments in joint ventures Long-term receivables Long-term prepaid rental expenses Deferred income tax assets 8,095 7,142 523 121 104 8,671 7,416 780 111 130 19 62 10.261 8,823 875 157 161 25 67 113 56 189 153 6,012 1,877 3,215 6,630 2,169 3,549 Current assets Inventories Trade and other receivables Derivative financial instruments Restricted cash Cash and cash equivalents Assets of disposal group classified as held-for-sale Total assets 5,065 1,907 2,647 0 24 487 2 11 490 417 14,683 499 402 16,891 13,160 EQUITY Equity attributable to equity holders of the company Share capital* Share premium Other reserves Retained earnings Non-controlling interests Total equity 6,988 2,003 184 854 3,947 7,858 2,003 184 944 4,727 8,814 2,003 184 874 5,753 6,992 7,862 8,818 LIABILITIES Non-current liabilities Borrowings Deferred income tax liabilities Deferred income on government grants 1,009 880 1,241 918 63 260 1,622 1,213 74 336 121 5,160 1,825 206 3,126 6,451 2,795 282 3,336 Current liabilities Trade and other payables Current income tax liabilities Borrowings Derivative financial instruments Current portion of deferred income on government grants Liabilities of disposal group classified as held-for-sale | Total liabilities Total equity and liabilities 5,581 2,374 259 2,899 8 7 32 6,822 14,683 2 3 14 22 8,073 16,891 6,169 13,160 EXHIBIT 3 (CONTINUED) b. Income Statement 5 | Revenue Cost of sales Gross profit Distribution costs and selling expenses Administrative expenses Research and development expenses Other income Other (losses) gains - net Operating profit Finance income Finance costs Finance costs - net Share of results of joint ventures millions of 2012 2013 10,247 11,501 (6,420) (6.831) 3,828 4,671 (779) (877) (763) (908) (236) (389) 63 (48) 0 2,065 2,552 2014 12,928 (7,566) 5,363 (982) (1,031) (518) 46 (43) 2,834 14 (241) (227) 54 3 (226) (224) 22 (202) (199) 26 31 Profit before income tax Income tax expense | Profit for the year 1,862 (338) 1,524 2,379 (462) 1,917 | 2,638 (422) 2,217 Earnings per share for profit attributable to equity holders of the company during the year Basic and diluted earnings per share (expressed in per share) Dividends proposed 0.76 1,001 | 0.96 1,001 1.11 n.a. EXHIBIT 3 (CONTINUED) c. Cash Flow Statement millions of 2013 2012 2014 Cash flow from operating activities Cash generated from operations | Income tax paid Net cash generated from operating activities 2,772 (346) 2.426 3,199 (382) 2.817 3,565 (435) 3.131 | 40 40 311 (1,881) 311 75 (2,793) 2793) Cash flow from investing activities Proceeds from disposal of PP&E (including leases) Purchases of PP&E (including leases and intellectual property Interest received Government grants received relating to PP&E Net cash used in investing activities (1,507) 2 83 (1,383)| 14 3 151 (1,417)| 93 (2,612) Cash flows from financing activities Borrowings and repayments | Dividends paid to the company's shareholders Interest paid Capital Injections Net cash used in financing activities (380) (801) (197) 14 (1,364) (186) (1,001) (209) 741 (1,001) (254) (1,396) (511) Net (decrease)/increase in cash and cash equivalents Cash and cash equivalents at beginning of the period Cash and cash equivalents at end of the period (320) 808 487 492 492 499 487 EXHIBIT 4: FINANCIAL PERFORMANCE MEASURES 2014 2013 2012 2011 2010 2009 2008 2007 2006 2005 12,928 11,501 10,247 9,689 8,508 6,079 5,717 5,166 917 3,935 614 2,911 392 2,217 1,917 1,525 1,513 1,118 246 16,891 14,683 1,788 10,567 40.42 9,051 9,333 9,462 6,551 30.51 41.48 40.61 37.35 36.56 42.05 31.32 36.18 34.76 a. Fuyao Glass Historical Performance Revenue (millions of ) Net Income (millions of W) Total Assets (millions of \) Gross Margin Percentage (%) Net Income Margin Percentage (%) Dividend Payout Ratio Dividend Yield Ratio Return on Assets (%) Return on Equity (%) Sustainable Growth Rate 17.15 16.66 14.88 15.61 21.01 18.39 4.30 17.76 15.60 13.46 n.a. 0.52 0.66 0.53 0.64 0.30 0.54 0.51 n.a. 0.06 0.06 0.05 0.04 0.01 0.00 0.02 0.01 0.00 13.12 13.05 11.58 12.39 16.92 12.35 9.69 8.08 5.98 2.64 7.53 25.14 24.38 21.86 24.27 30.60 25.49 26.01 21.07 17.73 n.a. 11.70 7.43 11.41 11.01 17.84 7.53 11.96 10.32 17.73 (%) 1 Current Ratio Debt Ratio Capitalization Ratio 1.03 0.48 0.34 1.08 0.46 0.33 0.98 0.47 0.36 1.04 0.49 n.a. .00 0.45 n.a. 0.99 0.52 0.78 0.65 0.88 0.63 0.94 0.62 0.92 0.66 n.a. n.a. n.a. n.a. n.a. b. Competitive Performance Revenue (millions of W) Net Income (millions of ) Total Assets (millions of ) Gross Margin (%) Net Income Margin (%) Dividend Payout Ratio Dividend Yield Ratio Return on Assets (%) Return on Equity (%) Sustainable Growth Rate (%) Current Ratio | Debt Ratio Capitalization Ratio Fuyao 12,928 2,217 16,891 41.48 17.15 n.a. n.a. 13.12 25.14 n.a. 1.03 0.48 0.34 For Year Ended December 31, 2014 Saint- AGC NSG Gobain 67,415 30,305 279,167 1,024 (824) 6,480 103,867 46,259 304,667 24.61 24.13 6.81 1.52 (0.03) 2.32 1.31 0.00 0.73 0.037 0.00 0.03 0.99 (1.78) 2.13 1.73 (9.45) 5.17 (0.53) (9.45) 1.40 1.76 1.03 1.35 0.43 0.81 0.59 0.33 0.72 0.40 Xinyi 8,689 1,092 16,827 25.17 12.57 0.43 0.01 6.49 8.85 5.04 1.00 0.41 0.33 EXHIBIT 5: PLANNED CAPITAL EXPENDITURES, 2015 AND 2016 Location and Type of Expenditure Year ended December 31, 2015 2016 (millions of W) 760 250 1,010 255 455 710 32 United States Auto glass Float glass U.S. subtotal Russia Auto glass Float glass Russia subtotal Others Auto glass in Shenyang Auto-glass technology upgrades Float-glass technology upgrades Other Others subtotal 470 525 995 32 190 1,400 200 158 1,948 2,990 1,000 200 100 1,300 3,005 Total EXHIBIT 6: BORROWINGS (MILLIONS OF ) Debt Type As of December 31 As of January 31 2015 2012 2013 2014 617.0 399.5 924.0 399.5 1,198.0 399.6 1,198.6 399.7 Non-Current Long-term bank borrowings Medium-term notes Less: current portion of non- current borrowings Subtotal (136.3) 880.2 (406.0) 917.5 (385.0) 1,212.6 (385.0) 1,213.3 1,146.4 1,843.1 1,260.6 1.232.7 2,640.9 309.7 2,687.3 311.3 | Current Short-term bank borrowings Short-term commercial papers Current portion of non-current borrowings Subtotal Total 136.3 406.0 385.0 385.0 3,125.8 4.006. 0 2,899.3 ,816.8 3,335.6 4,548.2 3,383.6 4,596.9 | 3 EXHIBIT 7: STOCK PRICES AND DIVIDEND PAYOUTS a. Stock Price Change around Dividend Payment Year Dividen d RMB Event Fuyao minus SSE 3-Day SSE Return (%) Date Fuyao Ending Share Price () 8.08 8.59 8.00 3-Day Fuyao Return (%) 1.25 -5.93 (%) Payout Ex-Dividend -0.84 1.81 2.08 -7.74 2014 0.50 Announcement 0.00 -3.49 3.49 2013 0.50 2012 0.40 Payout Ex-Dividend Announcement Payout Ex-Dividend Announcement Payout Ex-Dividend Announcement Payout Ex-Dividend Announcement May 19, 2014 May 13, 2014 February 25, 2014 June 7, 2013 June 3, 2013 March 19, 2013 July 6, 2012 June 27, 2012 April 25, 2012 April 8, 2011 March 30, 2011 March 2, 2011 April 29, 2010 April 20, 2010 March 10, 2010 8.10 9.00 8.42 7.60 8.40 8.28 12.16 12.95 12.59 11.11 11.82 12.45 -4.86 -8.94 1.66 -0.66 -6.92 2.64 2.13 -8.48 1.50 -2.03 -7.30 0.08 -5.55 -1.98 1.70 -2.57 0.15 0.67 0.71 -1.89 -0.07 -1.29 -3.15 -0.06 0.69 -6.97 -0.03 1.91 -7.07 1.97 1.42 -6.59 1.58 -0.74 -4.15 0.14 2011 0.57 2010 0.17 | Case Assignment Question: Prepare a pro forma cash flow forecast with 0.50 per year dividend by completing the following table. Fuyao Glass Pro Forma Cash Flow Forecast 2015 2018 2016 2017 (millions of ) Cash flows from operating activities Cash generated from operations Income tax paid Net cash generated from or (used in) operating activities Cash flow from investing activities Capital expenditures - United States Capital expenditures - Russia Capital expenditures -Others including China Working capital investment Net cash generated from or (used in) investing activities Net cash available before financing (4,335.50) (1,121.57) (949.42) (1,242.42) Cash flow from financing activities Borrowings or (Repayments) Dividends paid to the company's shareholders Other interest received Capital injections - issuance of new shares |Net cash generated from or (used in) financing activities 227.00 5.00 61.00 13.00 Net (decrease) or increase in cash and cash equivalents Cash and cash equivalents at beginning of the period Cash and cash equivalents at end of the period Notes: 1. Cash generated from operations and revenue increase at a constant rate of 10 per cent per year from 2014 to 2018. 2. Income tax paid is 12 per cent of cash generated from operations from 2015 to 2018. 3. In Exhibit 5, "Others" means Others including China. 4. Planned capital expenditures for Others including China remains the same amount from 2016 to 2018. 5. Working capital investment increases at a rate of 163 per cent of the change in cash generated from operating activities until 2018. EXHIBIT 2: PRODUCTION CAPACITY, UTILIZATION, AND EXPANSION PLANS Float Glass capacity (thousands of tonnes) utilization (%) 2012 2013 2014 Auto Glass capacity (thousands of tonnes) utilization (%) 2012 2013 2014 395.0 93.7 199.0 94.0 230.0 73.0 24.7 77.5 23.1 91.3 27.1 77.9 33.1 23.5 86.4 28.6 87.1 85.5 Existing Facilities China Northern China Capacity Utilization Central and Eastern China Capacity Utilization Southern China Capacity Utilization Southwestern China Capacity Utilization Russia Capacity Utilization 35.0 474.0 94.3 474.0 92.8 500.0 87.8 29.6 82.1 30.7 90.6 88.3 15.1 281.0 96.8 341.0 95.9 328.0 84.8 14.2 80.3 14.2 85.9 93.4 4.0 n.a. Float Glass Auto Glass 2017 n.a. Planned Facilities China (all regions) Russia United States 2015 0.0 0.0 150.0 2016 0.0 0.0 150.0 2017 2015 0.0 16.0 450.0 0.0 0.0 - 12.1 2016 0.0 8.1 0.0 n.a. n.a. n.a. = not available EXHIBIT 3: CONSOLIDATED FINANCIAL STATEMENTS a. Balance Sheet millions of 2012 2013 2014 ASSETS Non-current assets Property, plant, and equipment Leasehold land and land use rights | Intangible assets Investments in joint ventures Long-term receivables Long-term prepaid rental expenses Deferred income tax assets 8,095 7,142 523 121 104 8,671 7,416 780 111 130 19 62 10.261 8,823 875 157 161 25 67 113 56 189 153 6,012 1,877 3,215 6,630 2,169 3,549 Current assets Inventories Trade and other receivables Derivative financial instruments Restricted cash Cash and cash equivalents Assets of disposal group classified as held-for-sale Total assets 5,065 1,907 2,647 0 24 487 2 11 490 417 14,683 499 402 16,891 13,160 EQUITY Equity attributable to equity holders of the company Share capital* Share premium Other reserves Retained earnings Non-controlling interests Total equity 6,988 2,003 184 854 3,947 7,858 2,003 184 944 4,727 8,814 2,003 184 874 5,753 6,992 7,862 8,818 LIABILITIES Non-current liabilities Borrowings Deferred income tax liabilities Deferred income on government grants 1,009 880 1,241 918 63 260 1,622 1,213 74 336 121 5,160 1,825 206 3,126 6,451 2,795 282 3,336 Current liabilities Trade and other payables Current income tax liabilities Borrowings Derivative financial instruments Current portion of deferred income on government grants Liabilities of disposal group classified as held-for-sale | Total liabilities Total equity and liabilities 5,581 2,374 259 2,899 8 7 32 6,822 14,683 2 3 14 22 8,073 16,891 6,169 13,160 EXHIBIT 3 (CONTINUED) b. Income Statement 5 | Revenue Cost of sales Gross profit Distribution costs and selling expenses Administrative expenses Research and development expenses Other income Other (losses) gains - net Operating profit Finance income Finance costs Finance costs - net Share of results of joint ventures millions of 2012 2013 10,247 11,501 (6,420) (6.831) 3,828 4,671 (779) (877) (763) (908) (236) (389) 63 (48) 0 2,065 2,552 2014 12,928 (7,566) 5,363 (982) (1,031) (518) 46 (43) 2,834 14 (241) (227) 54 3 (226) (224) 22 (202) (199) 26 31 Profit before income tax Income tax expense | Profit for the year 1,862 (338) 1,524 2,379 (462) 1,917 | 2,638 (422) 2,217 Earnings per share for profit attributable to equity holders of the company during the year Basic and diluted earnings per share (expressed in per share) Dividends proposed 0.76 1,001 | 0.96 1,001 1.11 n.a. EXHIBIT 3 (CONTINUED) c. Cash Flow Statement millions of 2013 2012 2014 Cash flow from operating activities Cash generated from operations | Income tax paid Net cash generated from operating activities 2,772 (346) 2.426 3,199 (382) 2.817 3,565 (435) 3.131 | 40 40 311 (1,881) 311 75 (2,793) 2793) Cash flow from investing activities Proceeds from disposal of PP&E (including leases) Purchases of PP&E (including leases and intellectual property Interest received Government grants received relating to PP&E Net cash used in investing activities (1,507) 2 83 (1,383)| 14 3 151 (1,417)| 93 (2,612) Cash flows from financing activities Borrowings and repayments | Dividends paid to the company's shareholders Interest paid Capital Injections Net cash used in financing activities (380) (801) (197) 14 (1,364) (186) (1,001) (209) 741 (1,001) (254) (1,396) (511) Net (decrease)/increase in cash and cash equivalents Cash and cash equivalents at beginning of the period Cash and cash equivalents at end of the period (320) 808 487 492 492 499 487 EXHIBIT 4: FINANCIAL PERFORMANCE MEASURES 2014 2013 2012 2011 2010 2009 2008 2007 2006 2005 12,928 11,501 10,247 9,689 8,508 6,079 5,717 5,166 917 3,935 614 2,911 392 2,217 1,917 1,525 1,513 1,118 246 16,891 14,683 1,788 10,567 40.42 9,051 9,333 9,462 6,551 30.51 41.48 40.61 37.35 36.56 42.05 31.32 36.18 34.76 a. Fuyao Glass Historical Performance Revenue (millions of ) Net Income (millions of W) Total Assets (millions of \) Gross Margin Percentage (%) Net Income Margin Percentage (%) Dividend Payout Ratio Dividend Yield Ratio Return on Assets (%) Return on Equity (%) Sustainable Growth Rate 17.15 16.66 14.88 15.61 21.01 18.39 4.30 17.76 15.60 13.46 n.a. 0.52 0.66 0.53 0.64 0.30 0.54 0.51 n.a. 0.06 0.06 0.05 0.04 0.01 0.00 0.02 0.01 0.00 13.12 13.05 11.58 12.39 16.92 12.35 9.69 8.08 5.98 2.64 7.53 25.14 24.38 21.86 24.27 30.60 25.49 26.01 21.07 17.73 n.a. 11.70 7.43 11.41 11.01 17.84 7.53 11.96 10.32 17.73 (%) 1 Current Ratio Debt Ratio Capitalization Ratio 1.03 0.48 0.34 1.08 0.46 0.33 0.98 0.47 0.36 1.04 0.49 n.a. .00 0.45 n.a. 0.99 0.52 0.78 0.65 0.88 0.63 0.94 0.62 0.92 0.66 n.a. n.a. n.a. n.a. n.a. b. Competitive Performance Revenue (millions of W) Net Income (millions of ) Total Assets (millions of ) Gross Margin (%) Net Income Margin (%) Dividend Payout Ratio Dividend Yield Ratio Return on Assets (%) Return on Equity (%) Sustainable Growth Rate (%) Current Ratio | Debt Ratio Capitalization Ratio Fuyao 12,928 2,217 16,891 41.48 17.15 n.a. n.a. 13.12 25.14 n.a. 1.03 0.48 0.34 For Year Ended December 31, 2014 Saint- AGC NSG Gobain 67,415 30,305 279,167 1,024 (824) 6,480 103,867 46,259 304,667 24.61 24.13 6.81 1.52 (0.03) 2.32 1.31 0.00 0.73 0.037 0.00 0.03 0.99 (1.78) 2.13 1.73 (9.45) 5.17 (0.53) (9.45) 1.40 1.76 1.03 1.35 0.43 0.81 0.59 0.33 0.72 0.40 Xinyi 8,689 1,092 16,827 25.17 12.57 0.43 0.01 6.49 8.85 5.04 1.00 0.41 0.33 EXHIBIT 5: PLANNED CAPITAL EXPENDITURES, 2015 AND 2016 Location and Type of Expenditure Year ended December 31, 2015 2016 (millions of W) 760 250 1,010 255 455 710 32 United States Auto glass Float glass U.S. subtotal Russia Auto glass Float glass Russia subtotal Others Auto glass in Shenyang Auto-glass technology upgrades Float-glass technology upgrades Other Others subtotal 470 525 995 32 190 1,400 200 158 1,948 2,990 1,000 200 100 1,300 3,005 Total EXHIBIT 6: BORROWINGS (MILLIONS OF ) Debt Type As of December 31 As of January 31 2015 2012 2013 2014 617.0 399.5 924.0 399.5 1,198.0 399.6 1,198.6 399.7 Non-Current Long-term bank borrowings Medium-term notes Less: current portion of non- current borrowings Subtotal (136.3) 880.2 (406.0) 917.5 (385.0) 1,212.6 (385.0) 1,213.3 1,146.4 1,843.1 1,260.6 1.232.7 2,640.9 309.7 2,687.3 311.3 | Current Short-term bank borrowings Short-term commercial papers Current portion of non-current borrowings Subtotal Total 136.3 406.0 385.0 385.0 3,125.8 4.006. 0 2,899.3 ,816.8 3,335.6 4,548.2 3,383.6 4,596.9 | 3 EXHIBIT 7: STOCK PRICES AND DIVIDEND PAYOUTS a. Stock Price Change around Dividend Payment Year Dividen d RMB Event Fuyao minus SSE 3-Day SSE Return (%) Date Fuyao Ending Share Price () 8.08 8.59 8.00 3-Day Fuyao Return (%) 1.25 -5.93 (%) Payout Ex-Dividend -0.84 1.81 2.08 -7.74 2014 0.50 Announcement 0.00 -3.49 3.49 2013 0.50 2012 0.40 Payout Ex-Dividend Announcement Payout Ex-Dividend Announcement Payout Ex-Dividend Announcement Payout Ex-Dividend Announcement May 19, 2014 May 13, 2014 February 25, 2014 June 7, 2013 June 3, 2013 March 19, 2013 July 6, 2012 June 27, 2012 April 25, 2012 April 8, 2011 March 30, 2011 March 2, 2011 April 29, 2010 April 20, 2010 March 10, 2010 8.10 9.00 8.42 7.60 8.40 8.28 12.16 12.95 12.59 11.11 11.82 12.45 -4.86 -8.94 1.66 -0.66 -6.92 2.64 2.13 -8.48 1.50 -2.03 -7.30 0.08 -5.55 -1.98 1.70 -2.57 0.15 0.67 0.71 -1.89 -0.07 -1.29 -3.15 -0.06 0.69 -6.97 -0.03 1.91 -7.07 1.97 1.42 -6.59 1.58 -0.74 -4.15 0.14 2011 0.57 2010 0.17 |Step by Step Solution
There are 3 Steps involved in it
Step: 1

Get Instant Access to Expert-Tailored Solutions
See step-by-step solutions with expert insights and AI powered tools for academic success
Step: 2

Step: 3
Ace Your Homework with AI
Get the answers you need in no time with our AI-driven, step-by-step assistance
Get Started
Nmap Network Exploration And Security Auditing Cookbook
Authors: Paulino Calderon
2nd Revised Edition
1786467453, 978-1786467454