

Answered step by step
Verified Expert Solution
Question
1 Approved Answer
Could you help me with the D, E and F Question? Thanks! E-INVESTMENTS EXERCISES 1. Choose 10 firms that interest you and download their financial
Could you help me with the D, E and F Question? Thanks!
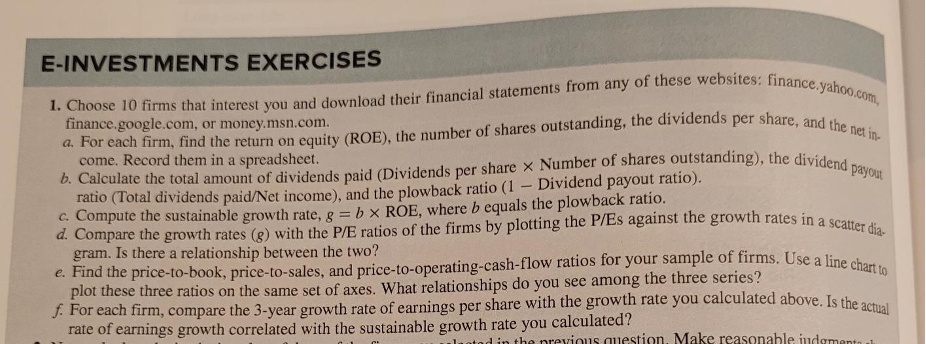
E-INVESTMENTS EXERCISES 1. Choose 10 firms that interest you and download their financial statements from any of these websites: finance.yahoo.com, finance.google.com, or money.msn.com. a. For each firm, find the return on equity (ROE), the number of shares outstanding, the dividends per share, and the net inb. Calculate the total amount of dividends paid (Dividends per share Number of shares outstanding), the dividend payout - Record them in a spreadsheet. ratio (Total dividends paid/Net income), and the plowback ratio (1 - Dividend payout ratio). c. Compute the sustainable growth rate, g=bROE, where b equals the plowback ratio. d. Compare the growth rates (g ) with the P/E ratios of the firms by plotting the P/Es against the growth rates in a scatter dia. gram. Is there a relationship between the two? e. Find the price-to-book, price-to-sales, and price-to-operating-cash-flow ratios for your sample of firms. Use a line chart to plot these three ratios on the same set of axes. What relationships do you see among the three series? f. For each firm, compare the 3-year growth rate of earnings per share with the growth rate you calculated above. Is the actual rate of earnings growth correlated with the sustainable growth rate you calculated? E-INVESTMENTS EXERCISES 1. Choose 10 firms that interest you and download their financial statements from any of these websites: finance.yahoo.com, finance.google.com, or money.msn.com. a. For each firm, find the return on equity (ROE), the number of shares outstanding, the dividends per share, and the net inb. Calculate the total amount of dividends paid (Dividends per share Number of shares outstanding), the dividend payout - Record them in a spreadsheet. ratio (Total dividends paid/Net income), and the plowback ratio (1 - Dividend payout ratio). c. Compute the sustainable growth rate, g=bROE, where b equals the plowback ratio. d. Compare the growth rates (g ) with the P/E ratios of the firms by plotting the P/Es against the growth rates in a scatter dia. gram. Is there a relationship between the two? e. Find the price-to-book, price-to-sales, and price-to-operating-cash-flow ratios for your sample of firms. Use a line chart to plot these three ratios on the same set of axes. What relationships do you see among the three series? f. For each firm, compare the 3-year growth rate of earnings per share with the growth rate you calculated above. Is the actual rate of earnings growth correlated with the sustainable growth rate you calculatedStep by Step Solution
There are 3 Steps involved in it
Step: 1

Get Instant Access to Expert-Tailored Solutions
See step-by-step solutions with expert insights and AI powered tools for academic success
Step: 2

Step: 3
Ace Your Homework with AI
Get the answers you need in no time with our AI-driven, step-by-step assistance
Get Started
Handbook Of Consumer Finance Research
Authors: Jing J. Xiao
1st Edition
1441926046, 978-1441926043