Could you help me with the ratio analysis for all three years concerning this company.
- The Stock price is 181.16
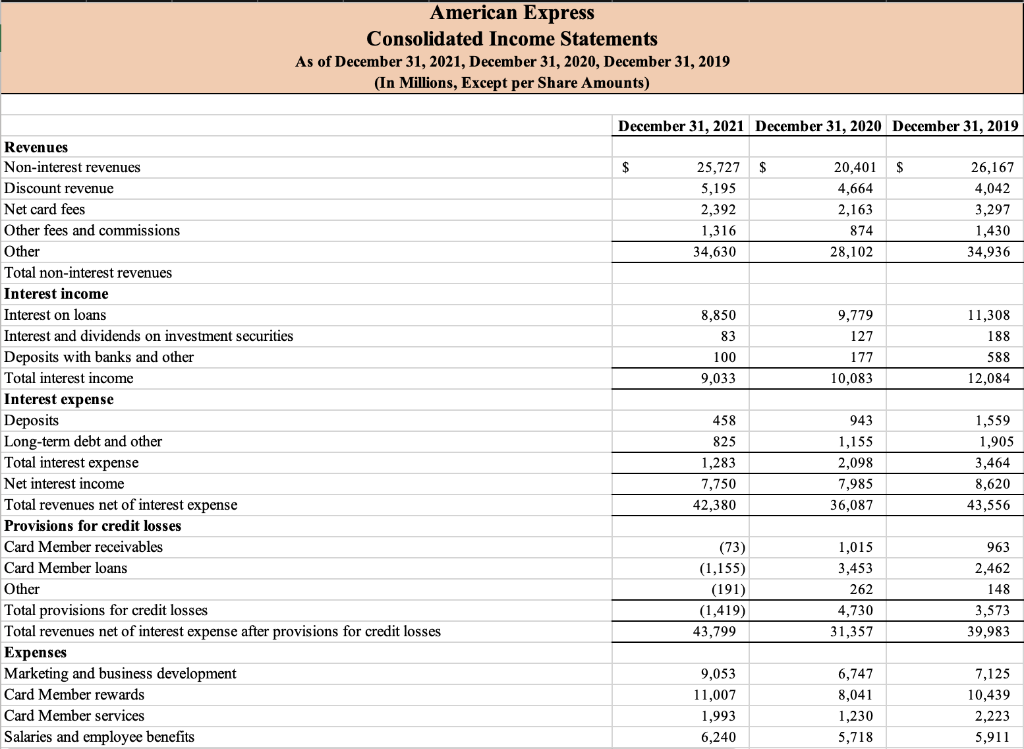

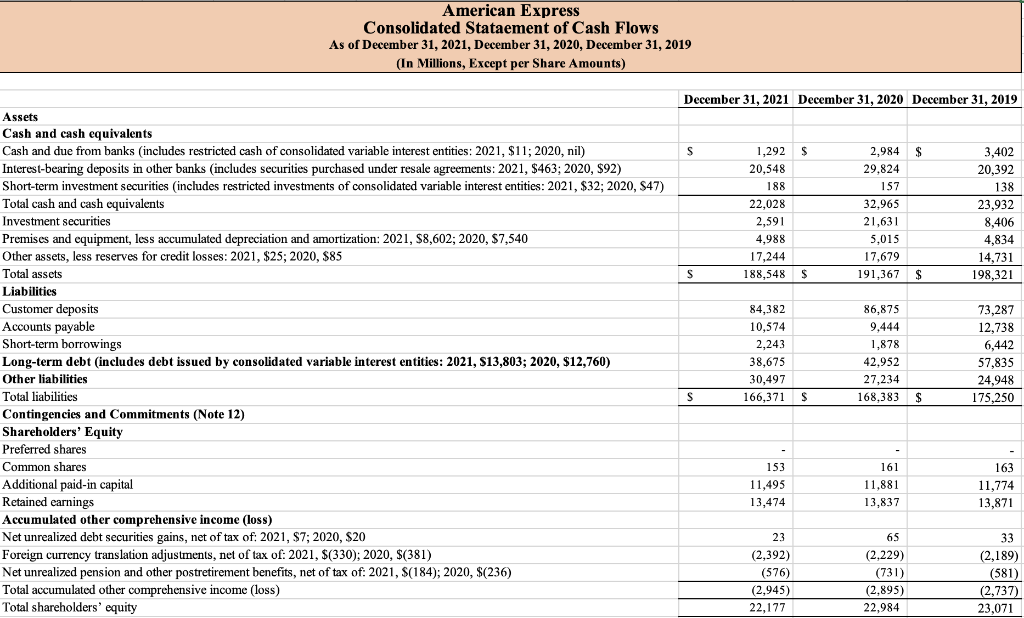

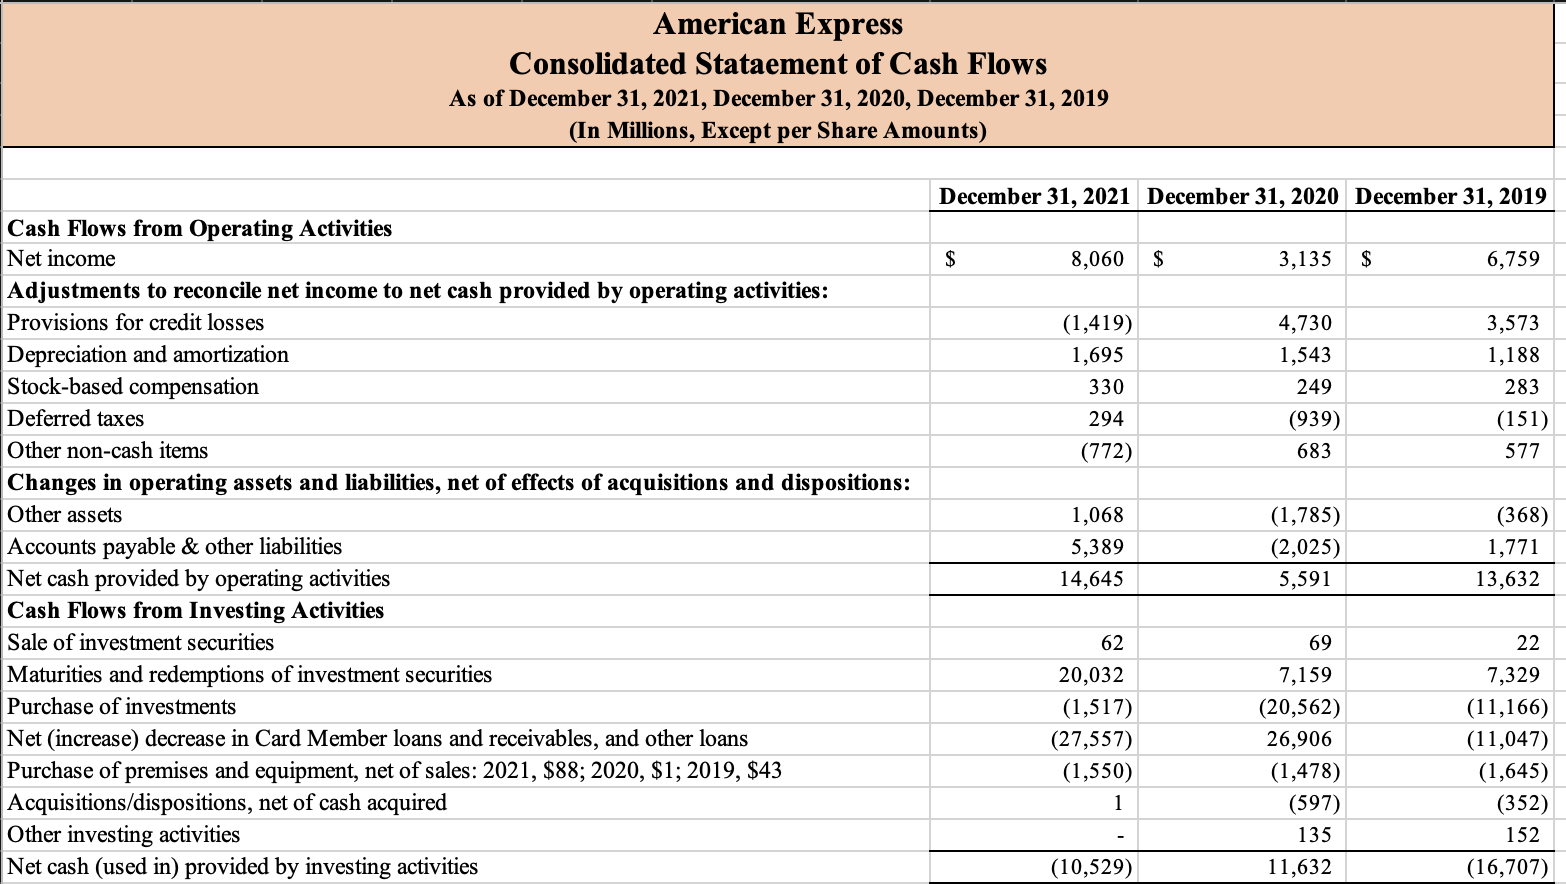

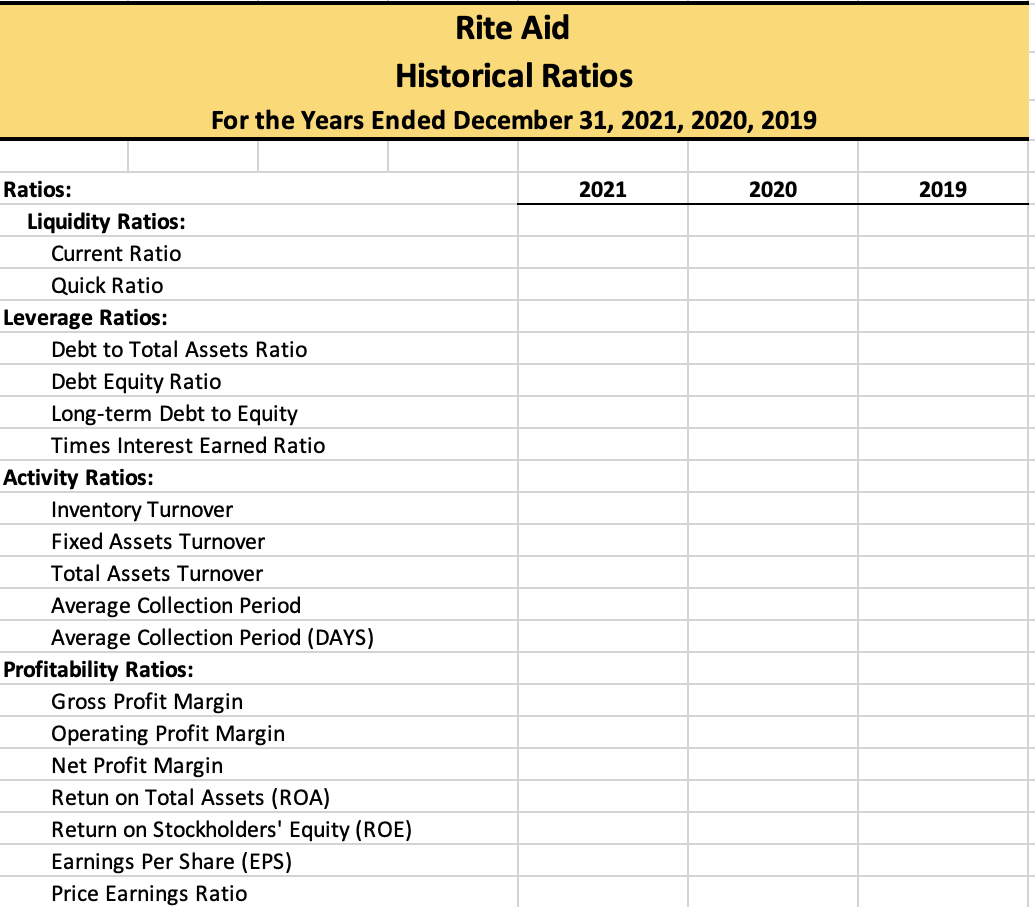
American Express Consolidated Income Statements As of December 31, 2021, December 31, 2020, December 31, 2019 (In Millions, Except per Share Amounts) December 31, 2021 December 31, 2020 December 31, 2019 $ 25,727 $ 5,195 2,392 1,316 34,630 20,401 $ 4,664 2,163 874 28,102 26,167 4,042 3,297 1,430 34,936 8,850 83 100 9,033 9,779 127 177 10,083 11,308 188 588 12,084 Revenues Non-interest revenues Discount revenue Net card fees Other fees and commissions Other Total non-interest revenues Interest income Interest on loans Interest and dividends on investment securities Deposits with banks and other Total interest income Interest expense Deposits Long-term debt and other Total interest expense Net interest income Total revenues net of interest expense Provisions for credit losses Card Member receivables Card Member loans Other Total provisions for credit losses Total revenues net of interest expense after provisions for credit losses Expenses Marketing and business development Card Member rewards Card Member services Salaries and employee benefits 458 825 1,283 7,750 42,380 943 1,155 2,098 7,985 36,087 1,559 1,905 3,464 8,620 43,556 (73) (1,155) (191) (1,419) 43,799 1,015 3,453 262 4,730 31,357 963 2,462 148 3,573 39,983 9,053 11,007 1,993 6,240 6,747 8,041 1,230 5,718 7,125 10,439 2,223 5,911 4,817 33,110 10,689 2,629 8,060.00 5,325 27,061 4,296 1,161 3,135.00 5,856 31,554 8,429 1,670 6,759.00 $ $ $ Other, net Total expenses Pretax income Income tax provision Net income Earnings per Common Share (Note 21)a) Basic Diluted Average common shares outstanding for earnings per common share: Basic Diluted $ 8.00 10.04 10.02 3,77 3,77 $ $ $ 7.99 789 805 828 790 806 830 American Express Consolidated Stataement of Cash Flows As of December 31, 2021, December 31, 2020, December 31, 2019 (In Millions, Except per Share Amounts) December 31, 2021 December 31, 2020 December 31, 2019 s 1,292 $ 20,548 188 22,028 2,591 4,988 17,244 188,548 $ 2,984 $ 29,824 157 32,965 21,631 5,015 17,679 191,367 $ 3,402 20,392 138 23,932 8,406 4,834 14,731 198,321 S Assets Cash and cash equivalents Cash and due from banks (includes restricted cash of consolidated variable interest entities: 2021, $11; 2020, nil) Interest-bearing deposits in other banks (includes securities purchased under resale agreements: 2021, $463; 2020, $92) Short-term investment securities (includes restricted investments of consolidated variable interest entities: 2021, $32; 2020, S47) Total cash and cash equivalents Investment securities Premises and equipment, less accumulated depreciation and amortization: 2021, $8,602; 2020, $7,540 Other assets, less reserves for credit losses: 2021, $25; 2020, $85 Total assets Liabilities Customer deposits Accounts payable Short-term borrowings Long-term debt (includes debt issued by consolidated variable interest entities: 2021, 13,803; 2020, $12,760) Other liabilities Total liabilities Contingencies and Commitments (Note 12) Shareholders' Equity Preferred shares Common shares Additional paid-in capital Retained earnings Accumulated other comprehensive income (loss) Net unrealized debt securities gains, net of tax of: 2021, $7; 2020, $20 Foreign currency translation adjustments, net of tax of: 2021, $(330): 2020, $(381) Net unrealized pension and other postretirement benefits, net of tax of: 2021, $(184); 2020, $(236) Total accumulated other comprehensive income (loss) Total shareholders' equity 84,382 10,574 2,243 38,675 30,497 166,371 86,875 9,444 1,878 42.952 27,234 73,287 12,738 6,442 57,835 24,948 175,250 S S S 168,383 $ 161 153 11,495 13,474 11,881 13,837 163 11,774 13,871 23 (2,392) (576) (2,945) 22,177 65 (2,229) (731) (2,895) 22,984 33 (2,189) (581) (2,737) 23,071 Accumulated other comprehensive income (loss) Net unrealized debt securities gains, net of tax of: 2021, $7; 2020, $20 Foreign currency translation adjustments, net of tax of: 2021, $(330); 2020, $(381) Net unrealized pension and other postretirement benefits, net of tax of: 2021, $(184); 2020, $(236) Total accumulated other comprehensive income (loss) Total shareholders' equity Total liabilities and shareholders' equity 23 (2,392) (576) (2,945) 22,177 188,548 65 (2,229) (731) (2,895) 22,984 191,367 33 (2,189) (581) (2,737) 23,071 198,321 $ $ $ American Express Consolidated Stataement of Cash Flows As of December 31, 2021, December 31, 2020, December 31, 2019 (In Millions, Except per Share Amounts) December 31, 2021 December 31, 2020 December 31, 2019 $ 8,060 $ 3,135 $ 6,759 (1,419) 1,695 330 4,730 1,543 249 (939) 683 3,573 1,188 283 (151) 577 294 (772) Cash Flows from Operating Activities Net income Adjustments to reconcile net income to net cash provided by operating activities: Provisions for credit losses Depreciation and amortization Stock-based compensation Deferred taxes Other non-cash items Changes in operating assets and liabilities, net of effects of acquisitions and dispositions: Other assets Accounts payable & other liabilities Net cash provided by operating activities Cash Flows from Investing Activities Sale of investment securities Maturities and redemptions of investment securities Purchase of investments Net (increase) decrease in Card Member loans and receivables, and other loans Purchase of premises and equipment, net of sales: 2021, $88; 2020, $1; 2019, $43 Acquisitions/dispositions, net of cash acquired Other investing activities Net cash (used in) provided by investing activities 1,068 5,389 14,645 (1,785) (2,025) 5,591 (368) 1,771 13,632 22 62 20,032 (1,517) (27,557) (1,550) 1 69 7,159 (20,562) 26,906 (1,478) (597) 135 11,632 7,329 (11,166) (11,047) (1,645) (352) 152 (16,707) (10,529) 13,542 (4,627) 69 (15,593) 3,330 3,316 12,706 (13,850) Cash Flows from Financing Activities Net (decrease) increase in customer deposits Net increase (decrease) in short-term borrowings Proceeds from long-term debt Payments of long-term debt Issuance of American Express preferred shares Redemption of American Express preferred shares Issuance of American Express common shares Repurchase of American Express common shares and other Dividends paid Net cash used in financing activities Effect of foreign currency exchange rates on cash and cash equivalents Net (decrease) increase in cash and cash equivalents Cash and cash equivalents at beginning of year Cash and cash equivalents at end of year (2,468) 461 7,788 (11,662) 1,584 (1,600) 64 (7,652) (1,448) (14,933) (120) (10,937) 32,965 22,028 44 (1,029) (1,474) (9,068) 364 8,519 24,446 32,965 86 (4,685) (1,422) (519) 232 (3,362) 27,808 24,446 $ $ $ Rite Aid Historical Ratios For the Years Ended December 31, 2021, 2020, 2019 2021 2020 2019 Ratios: Liquidity Ratios: Current Ratio Quick Ratio Leverage Ratios: Debt to Total Assets Ratio Debt Equity Ratio Long-term Debt to Equity Times Interest Earned Ratio Activity Ratios: Inventory Turnover Fixed Assets Turnover Total Assets Turnover Average Collection Period Average Collection Period (DAYS) Profitability Ratios: Gross Profit Margin Operating Profit Margin Net Profit Margin Retun on Total Assets (ROA) Return on Stockholders' Equity (ROE) Earnings Per Share (EPS) Price Earnings Ratio American Express Consolidated Income Statements As of December 31, 2021, December 31, 2020, December 31, 2019 (In Millions, Except per Share Amounts) December 31, 2021 December 31, 2020 December 31, 2019 $ 25,727 $ 5,195 2,392 1,316 34,630 20,401 $ 4,664 2,163 874 28,102 26,167 4,042 3,297 1,430 34,936 8,850 83 100 9,033 9,779 127 177 10,083 11,308 188 588 12,084 Revenues Non-interest revenues Discount revenue Net card fees Other fees and commissions Other Total non-interest revenues Interest income Interest on loans Interest and dividends on investment securities Deposits with banks and other Total interest income Interest expense Deposits Long-term debt and other Total interest expense Net interest income Total revenues net of interest expense Provisions for credit losses Card Member receivables Card Member loans Other Total provisions for credit losses Total revenues net of interest expense after provisions for credit losses Expenses Marketing and business development Card Member rewards Card Member services Salaries and employee benefits 458 825 1,283 7,750 42,380 943 1,155 2,098 7,985 36,087 1,559 1,905 3,464 8,620 43,556 (73) (1,155) (191) (1,419) 43,799 1,015 3,453 262 4,730 31,357 963 2,462 148 3,573 39,983 9,053 11,007 1,993 6,240 6,747 8,041 1,230 5,718 7,125 10,439 2,223 5,911 4,817 33,110 10,689 2,629 8,060.00 5,325 27,061 4,296 1,161 3,135.00 5,856 31,554 8,429 1,670 6,759.00 $ $ $ Other, net Total expenses Pretax income Income tax provision Net income Earnings per Common Share (Note 21)a) Basic Diluted Average common shares outstanding for earnings per common share: Basic Diluted $ 8.00 10.04 10.02 3,77 3,77 $ $ $ 7.99 789 805 828 790 806 830 American Express Consolidated Stataement of Cash Flows As of December 31, 2021, December 31, 2020, December 31, 2019 (In Millions, Except per Share Amounts) December 31, 2021 December 31, 2020 December 31, 2019 s 1,292 $ 20,548 188 22,028 2,591 4,988 17,244 188,548 $ 2,984 $ 29,824 157 32,965 21,631 5,015 17,679 191,367 $ 3,402 20,392 138 23,932 8,406 4,834 14,731 198,321 S Assets Cash and cash equivalents Cash and due from banks (includes restricted cash of consolidated variable interest entities: 2021, $11; 2020, nil) Interest-bearing deposits in other banks (includes securities purchased under resale agreements: 2021, $463; 2020, $92) Short-term investment securities (includes restricted investments of consolidated variable interest entities: 2021, $32; 2020, S47) Total cash and cash equivalents Investment securities Premises and equipment, less accumulated depreciation and amortization: 2021, $8,602; 2020, $7,540 Other assets, less reserves for credit losses: 2021, $25; 2020, $85 Total assets Liabilities Customer deposits Accounts payable Short-term borrowings Long-term debt (includes debt issued by consolidated variable interest entities: 2021, 13,803; 2020, $12,760) Other liabilities Total liabilities Contingencies and Commitments (Note 12) Shareholders' Equity Preferred shares Common shares Additional paid-in capital Retained earnings Accumulated other comprehensive income (loss) Net unrealized debt securities gains, net of tax of: 2021, $7; 2020, $20 Foreign currency translation adjustments, net of tax of: 2021, $(330): 2020, $(381) Net unrealized pension and other postretirement benefits, net of tax of: 2021, $(184); 2020, $(236) Total accumulated other comprehensive income (loss) Total shareholders' equity 84,382 10,574 2,243 38,675 30,497 166,371 86,875 9,444 1,878 42.952 27,234 73,287 12,738 6,442 57,835 24,948 175,250 S S S 168,383 $ 161 153 11,495 13,474 11,881 13,837 163 11,774 13,871 23 (2,392) (576) (2,945) 22,177 65 (2,229) (731) (2,895) 22,984 33 (2,189) (581) (2,737) 23,071 Accumulated other comprehensive income (loss) Net unrealized debt securities gains, net of tax of: 2021, $7; 2020, $20 Foreign currency translation adjustments, net of tax of: 2021, $(330); 2020, $(381) Net unrealized pension and other postretirement benefits, net of tax of: 2021, $(184); 2020, $(236) Total accumulated other comprehensive income (loss) Total shareholders' equity Total liabilities and shareholders' equity 23 (2,392) (576) (2,945) 22,177 188,548 65 (2,229) (731) (2,895) 22,984 191,367 33 (2,189) (581) (2,737) 23,071 198,321 $ $ $ American Express Consolidated Stataement of Cash Flows As of December 31, 2021, December 31, 2020, December 31, 2019 (In Millions, Except per Share Amounts) December 31, 2021 December 31, 2020 December 31, 2019 $ 8,060 $ 3,135 $ 6,759 (1,419) 1,695 330 4,730 1,543 249 (939) 683 3,573 1,188 283 (151) 577 294 (772) Cash Flows from Operating Activities Net income Adjustments to reconcile net income to net cash provided by operating activities: Provisions for credit losses Depreciation and amortization Stock-based compensation Deferred taxes Other non-cash items Changes in operating assets and liabilities, net of effects of acquisitions and dispositions: Other assets Accounts payable & other liabilities Net cash provided by operating activities Cash Flows from Investing Activities Sale of investment securities Maturities and redemptions of investment securities Purchase of investments Net (increase) decrease in Card Member loans and receivables, and other loans Purchase of premises and equipment, net of sales: 2021, $88; 2020, $1; 2019, $43 Acquisitions/dispositions, net of cash acquired Other investing activities Net cash (used in) provided by investing activities 1,068 5,389 14,645 (1,785) (2,025) 5,591 (368) 1,771 13,632 22 62 20,032 (1,517) (27,557) (1,550) 1 69 7,159 (20,562) 26,906 (1,478) (597) 135 11,632 7,329 (11,166) (11,047) (1,645) (352) 152 (16,707) (10,529) 13,542 (4,627) 69 (15,593) 3,330 3,316 12,706 (13,850) Cash Flows from Financing Activities Net (decrease) increase in customer deposits Net increase (decrease) in short-term borrowings Proceeds from long-term debt Payments of long-term debt Issuance of American Express preferred shares Redemption of American Express preferred shares Issuance of American Express common shares Repurchase of American Express common shares and other Dividends paid Net cash used in financing activities Effect of foreign currency exchange rates on cash and cash equivalents Net (decrease) increase in cash and cash equivalents Cash and cash equivalents at beginning of year Cash and cash equivalents at end of year (2,468) 461 7,788 (11,662) 1,584 (1,600) 64 (7,652) (1,448) (14,933) (120) (10,937) 32,965 22,028 44 (1,029) (1,474) (9,068) 364 8,519 24,446 32,965 86 (4,685) (1,422) (519) 232 (3,362) 27,808 24,446 $ $ $ Rite Aid Historical Ratios For the Years Ended December 31, 2021, 2020, 2019 2021 2020 2019 Ratios: Liquidity Ratios: Current Ratio Quick Ratio Leverage Ratios: Debt to Total Assets Ratio Debt Equity Ratio Long-term Debt to Equity Times Interest Earned Ratio Activity Ratios: Inventory Turnover Fixed Assets Turnover Total Assets Turnover Average Collection Period Average Collection Period (DAYS) Profitability Ratios: Gross Profit Margin Operating Profit Margin Net Profit Margin Retun on Total Assets (ROA) Return on Stockholders' Equity (ROE) Earnings Per Share (EPS) Price Earnings Ratio


