Answered step by step
Verified Expert Solution
Link Copied!

Question

1 Approved Answer

could you help to check the solution to the 3 questions,is the answer correct? Histogram of PULocationl Histogram of DOLocation! 40 80 120 20 40

could you help to check the solution to the 3 questions,is the answer correct?
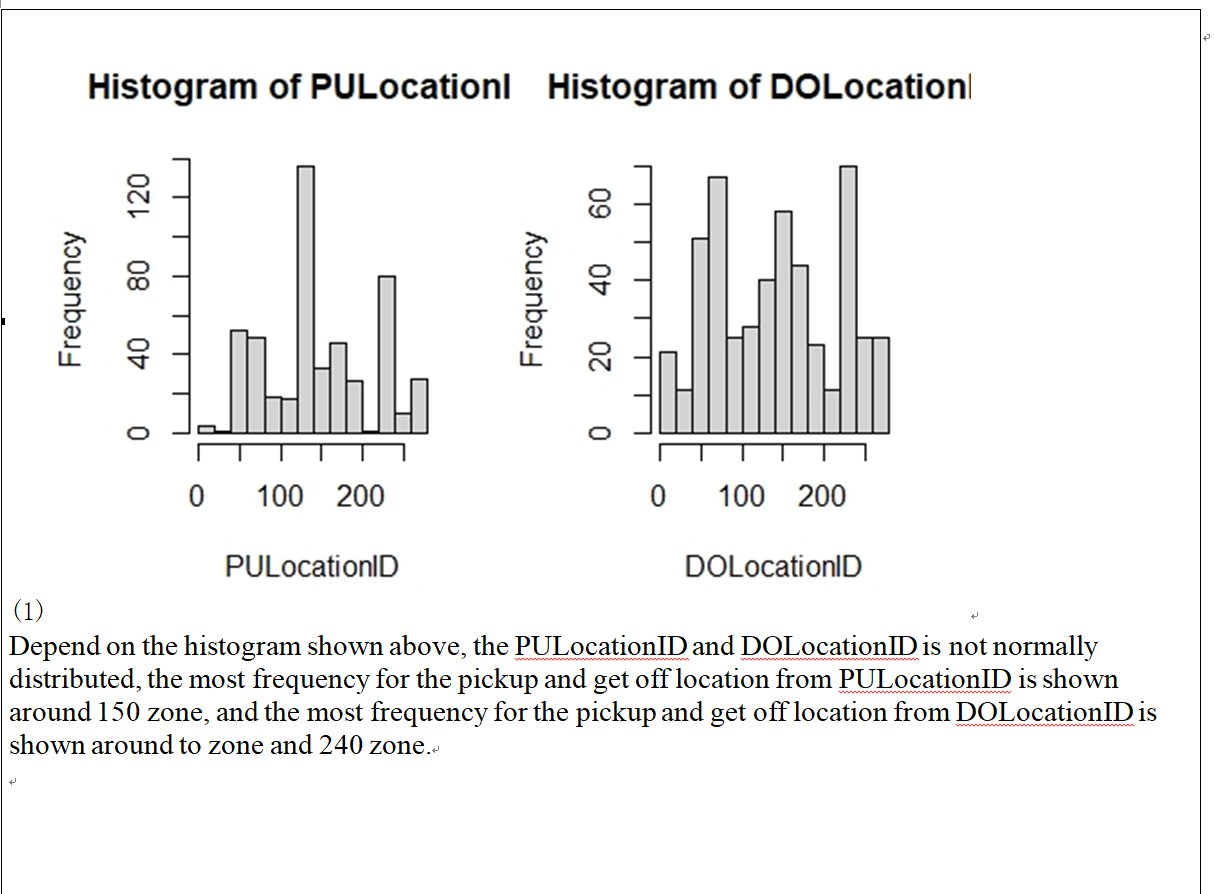
image text in transcribedimage text in transcribedimage text in transcribedimage text in transcribed
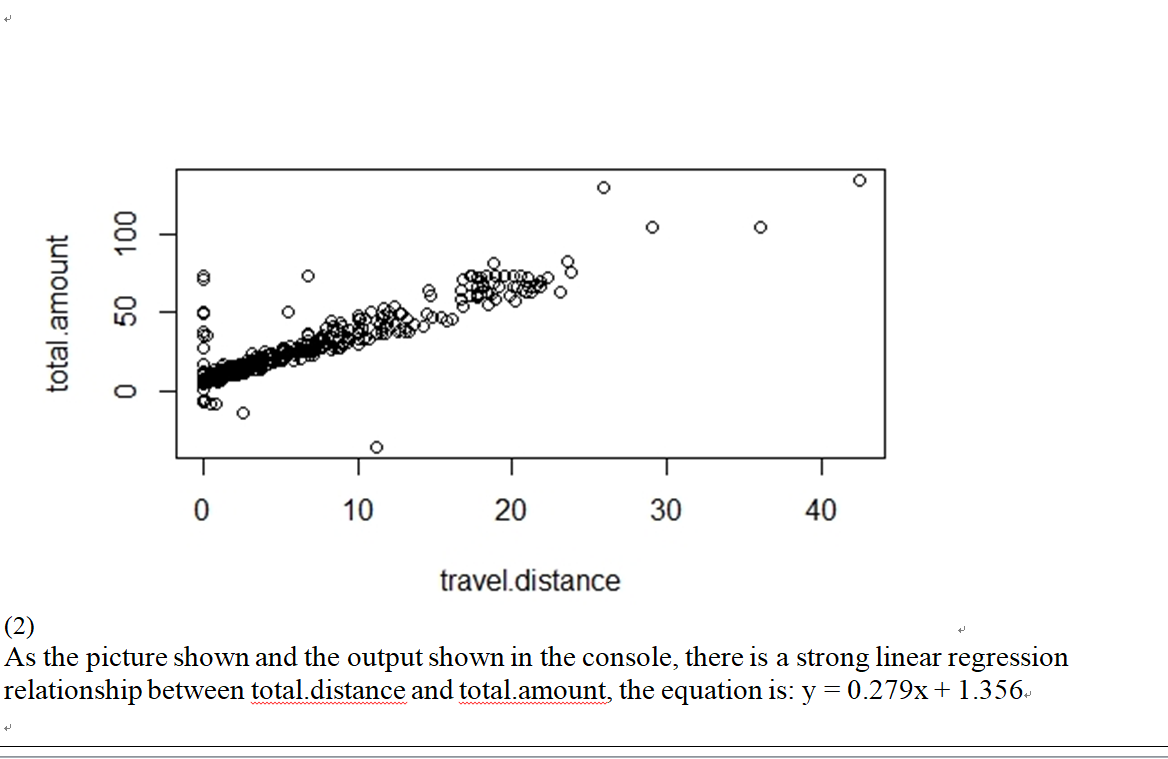
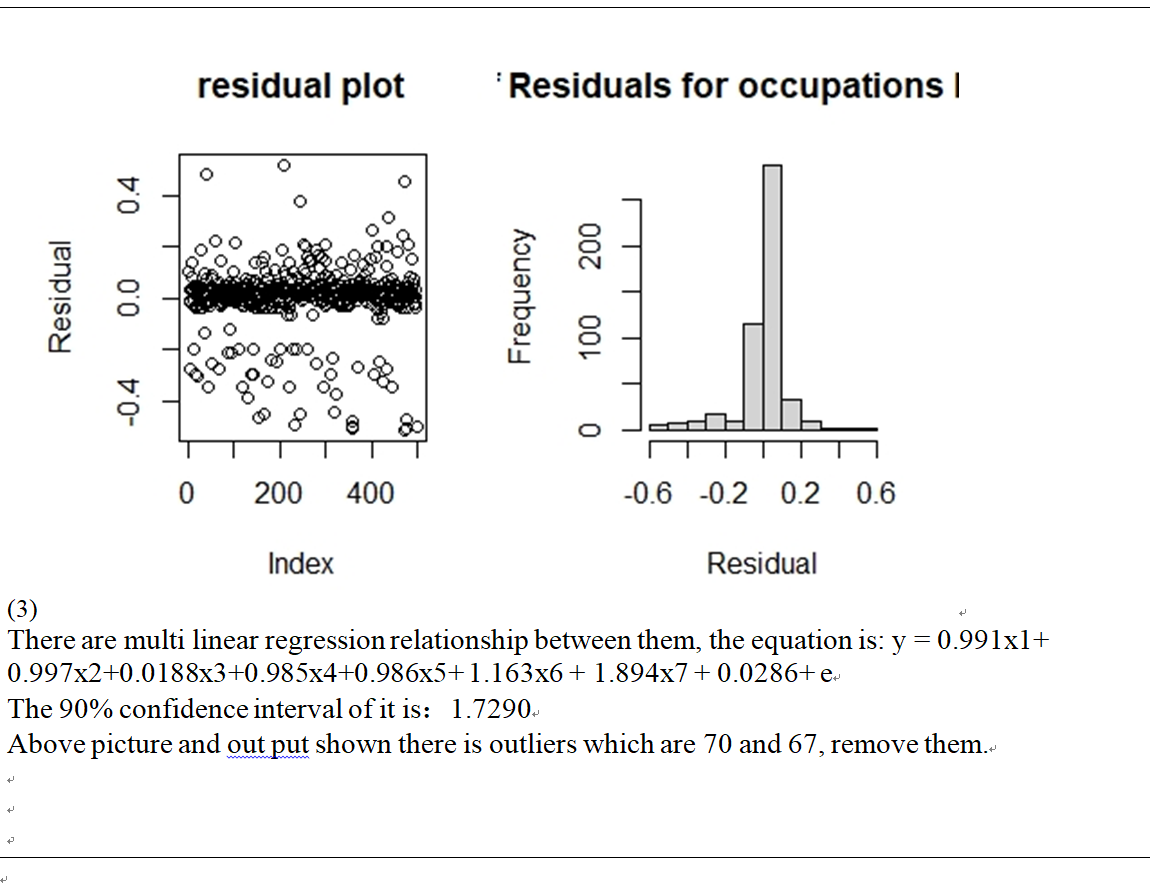
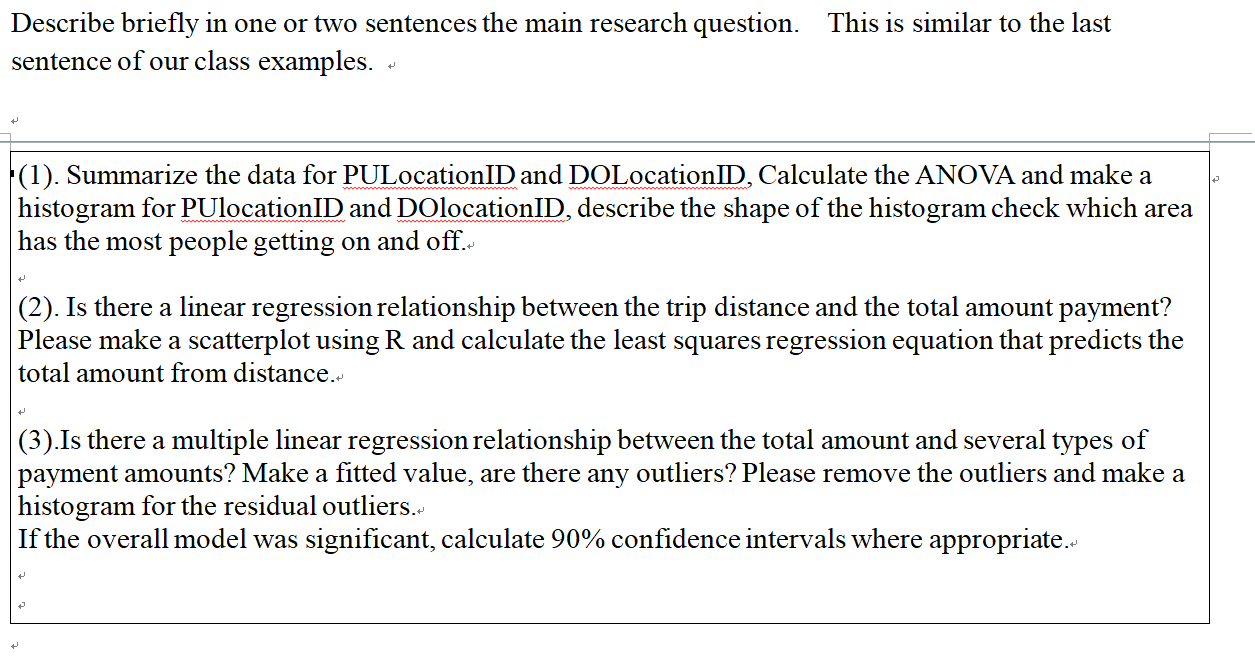
Histogram of PULocationl Histogram of DOLocation! 40 80 120 20 40 60 Frequency Frequency O O 0 100 200 100 200 PULocationID DOLocationID (1) Depend on the histogram shown above, the PULocationID and DOLocationID is not normally distributed, the most frequency for the pickup and get off location from PULocationID is shown around 150 zone, and the most frequency for the pickup and get off location from DOLocationID is shown around to zone and 240 zone.+O O 50 100 O O O 8 total.amount O O O O 0 10 20 30 40 (2) travel.distance As the picture shown and the output shown in the console, there is a strong linear regression relationship between total.distance and total amount, the equation is: y = 0.279x + 1.356-residual plot Residuals for occupations I O O 0.0 Residual Frequency 100 200 -0.4 80 O 0 200 400 -0.6 -0.2 0.2 0.6 Index Residual (3) There are multi linear regression relationship between them, the equation is: y = 0.991x1+ 0.997x2+0.0188x3+0.985x4+0.986x5+ 1.163x6 + 1.894x7 + 0.0286+e. The 90% confidence interval of it is: 1.7290- Above picture and out put shown there is outliers which are 70 and 67, remove them.+Describe briey in one or two sentences the main research question. This is similar to the last sentence of our class examples. 0 4J ' (1 ). Summarize the data for PULocationID and DOLocationlD Calculate the ANOVA and make a histogram for PUlocationID and DOlocationID, describe the shape of the histogram check which area has the most people getting on and off} .J (2). Is there a linear regression relationship between the trip distance and the total amount payment? Please make a scatterplot using R and calculate the least squares regression equation that predicts the total amount from distance. (3)_Is there a multiple linear regression relationship between the total amount and several types of payment amounts? Make a tted value, are there any outliers? Please remove the outliers and make a histogram for the residual outliers. If the overall model was signicant, calculate 90% condence intervals where appropriated .J 4:! .J

Step by Step Solution

There are 3 Steps involved in it

Step: 1

blur-text-image

Get Instant Access to Expert-Tailored Solutions

See step-by-step solutions with expert insights and AI powered tools for academic success

Step: 2

blur-text-image_2

Step: 3

blur-text-image_3

Ace Your Homework with AI

Get the answers you need in no time with our AI-driven, step-by-step assistance

Get Started

Recommended Textbook for

Birds Higher Engineering Mathematics

Authors: John Bird

9th Edition

1000353036, 9781000353037

More Books

Students also viewed these Mathematics questions