

Answered step by step
Verified Expert Solution
Question
1 Approved Answer
Could you please help me and see if it runs. Thanks COP4814 Assignment 3 (80 Points in total) Stock Price Observer (75 points) Using a
Could you please help me and see if it runs. Thanks
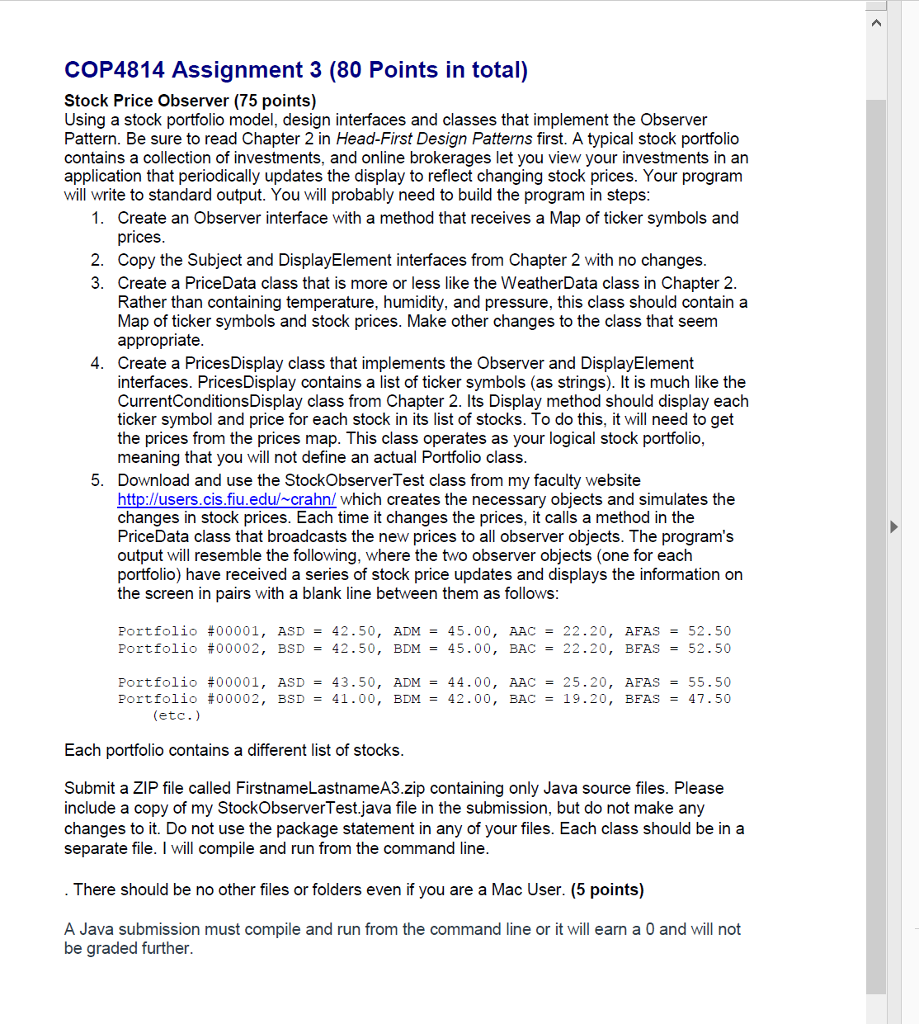
COP4814 Assignment 3 (80 Points in total) Stock Price Observer (75 points) Using a stock portfolio model, design interfaces and classes that implement the Observer Pattern. Be sure to read Chapter 2 in Head-First Design Patterns first. A typical stock portfolio contains a collection of investments, and online brokerages let you view your investments in an application that periodically updates the display to reflect changing stock prices. Your program will write to standard output. You will probably need to build the program in steps Create an Observer interface with a method that receives a Map of ticker symbols and prices 1. 2. Copy the Subject and DisplayElement interfaces from Chapter 2 with no changes 3. Create a PriceData class that is more or less like the WeatherData class in Chapter 2 Rather than containing temperature, humidity, and pressure, this class should contain a Map of ticker symbols and stock prices. Make other changes to the class that seem appropriate Create a PricesDisplay class that implements the Observer and DisplayElement interfaces. PricesDisplay contains a list of ticker symbols (as strings). It is much like the CurrentConditionsDisplay class from Chapter 2. Its Display method should display each ticker symbol and price for each stock in its list of stocks. To do this, it will need to get the prices from the prices map. This class operates as your logical stock portfolio, meaning that you will not define an actual Portfolio class 4. 5. Download and use the StockObserverTest class from my faculty website http://users.cis.fiu.edu/~crahn/ which creates the necessary obiects and simulates the changes in stock prices. Each time it changes the prices, it calls a method in the PriceData class that broadcasts the new prices to all observer objects. The program's output will resemble the following, where the two observer objects (one for each portfolio) have received a series of stocK price updates and displays the information on the screen in pairs with a blank line between them as follows Portfolio #00001, AS D- 42.50, ADM- 45.00, AAC_ 22.20, AFAS Portfolio #00002, BSD= 42.50, BDM= 45.00, BAC= 22.20, BFAS 52.50 52.50 Portfolio #00001, ASD= 43.50, ADM 44.00, AAC = 25.20, AFAS 55.50 Portfolio #00002, BSD = 41.00, BDM = 42.00, BAC= 19.20, BEAS = 47.50 (etc.) Each portfolio contains a different list of stocks Submit a ZIP file called FirstnameLastnameA3.zip containing only Java source files. Please include a copy of my StockObserverTest.java file in the submission, but do not make any changes to it. Do not use the package statement in any of your files. Each class should be in a separate file. I will compile and run from the command line There should be no other files or folders even if you are a Mac User. (5 points) A Java submission must compile and run from the command line or it will earn a 0 and will not be graded further. COP4814 Assignment 3 (80 Points in total) Stock Price Observer (75 points) Using a stock portfolio model, design interfaces and classes that implement the Observer Pattern. Be sure to read Chapter 2 in Head-First Design Patterns first. A typical stock portfolio contains a collection of investments, and online brokerages let you view your investments in an application that periodically updates the display to reflect changing stock prices. Your program will write to standard output. You will probably need to build the program in steps Create an Observer interface with a method that receives a Map of ticker symbols and prices 1. 2. Copy the Subject and DisplayElement interfaces from Chapter 2 with no changes 3. Create a PriceData class that is more or less like the WeatherData class in Chapter 2 Rather than containing temperature, humidity, and pressure, this class should contain a Map of ticker symbols and stock prices. Make other changes to the class that seem appropriate Create a PricesDisplay class that implements the Observer and DisplayElement interfaces. PricesDisplay contains a list of ticker symbols (as strings). It is much like the CurrentConditionsDisplay class from Chapter 2. Its Display method should display each ticker symbol and price for each stock in its list of stocks. To do this, it will need to get the prices from the prices map. This class operates as your logical stock portfolio, meaning that you will not define an actual Portfolio class 4. 5. Download and use the StockObserverTest class from my faculty website http://users.cis.fiu.edu/~crahn/ which creates the necessary obiects and simulates the changes in stock prices. Each time it changes the prices, it calls a method in the PriceData class that broadcasts the new prices to all observer objects. The program's output will resemble the following, where the two observer objects (one for each portfolio) have received a series of stocK price updates and displays the information on the screen in pairs with a blank line between them as follows Portfolio #00001, AS D- 42.50, ADM- 45.00, AAC_ 22.20, AFAS Portfolio #00002, BSD= 42.50, BDM= 45.00, BAC= 22.20, BFAS 52.50 52.50 Portfolio #00001, ASD= 43.50, ADM 44.00, AAC = 25.20, AFAS 55.50 Portfolio #00002, BSD = 41.00, BDM = 42.00, BAC= 19.20, BEAS = 47.50 (etc.) Each portfolio contains a different list of stocks Submit a ZIP file called FirstnameLastnameA3.zip containing only Java source files. Please include a copy of my StockObserverTest.java file in the submission, but do not make any changes to it. Do not use the package statement in any of your files. Each class should be in a separate file. I will compile and run from the command line There should be no other files or folders even if you are a Mac User. (5 points) A Java submission must compile and run from the command line or it will earn a 0 and will not be graded further
Step by Step Solution
There are 3 Steps involved in it
Step: 1

Get Instant Access to Expert-Tailored Solutions
See step-by-step solutions with expert insights and AI powered tools for academic success
Step: 2

Step: 3
Ace Your Homework with AI
Get the answers you need in no time with our AI-driven, step-by-step assistance
Get Started
Databases A Beginners Guide
Authors: Andy Oppel
1st Edition
007160846X, 978-0071608466