Could you please help me answer this question? Thank you!
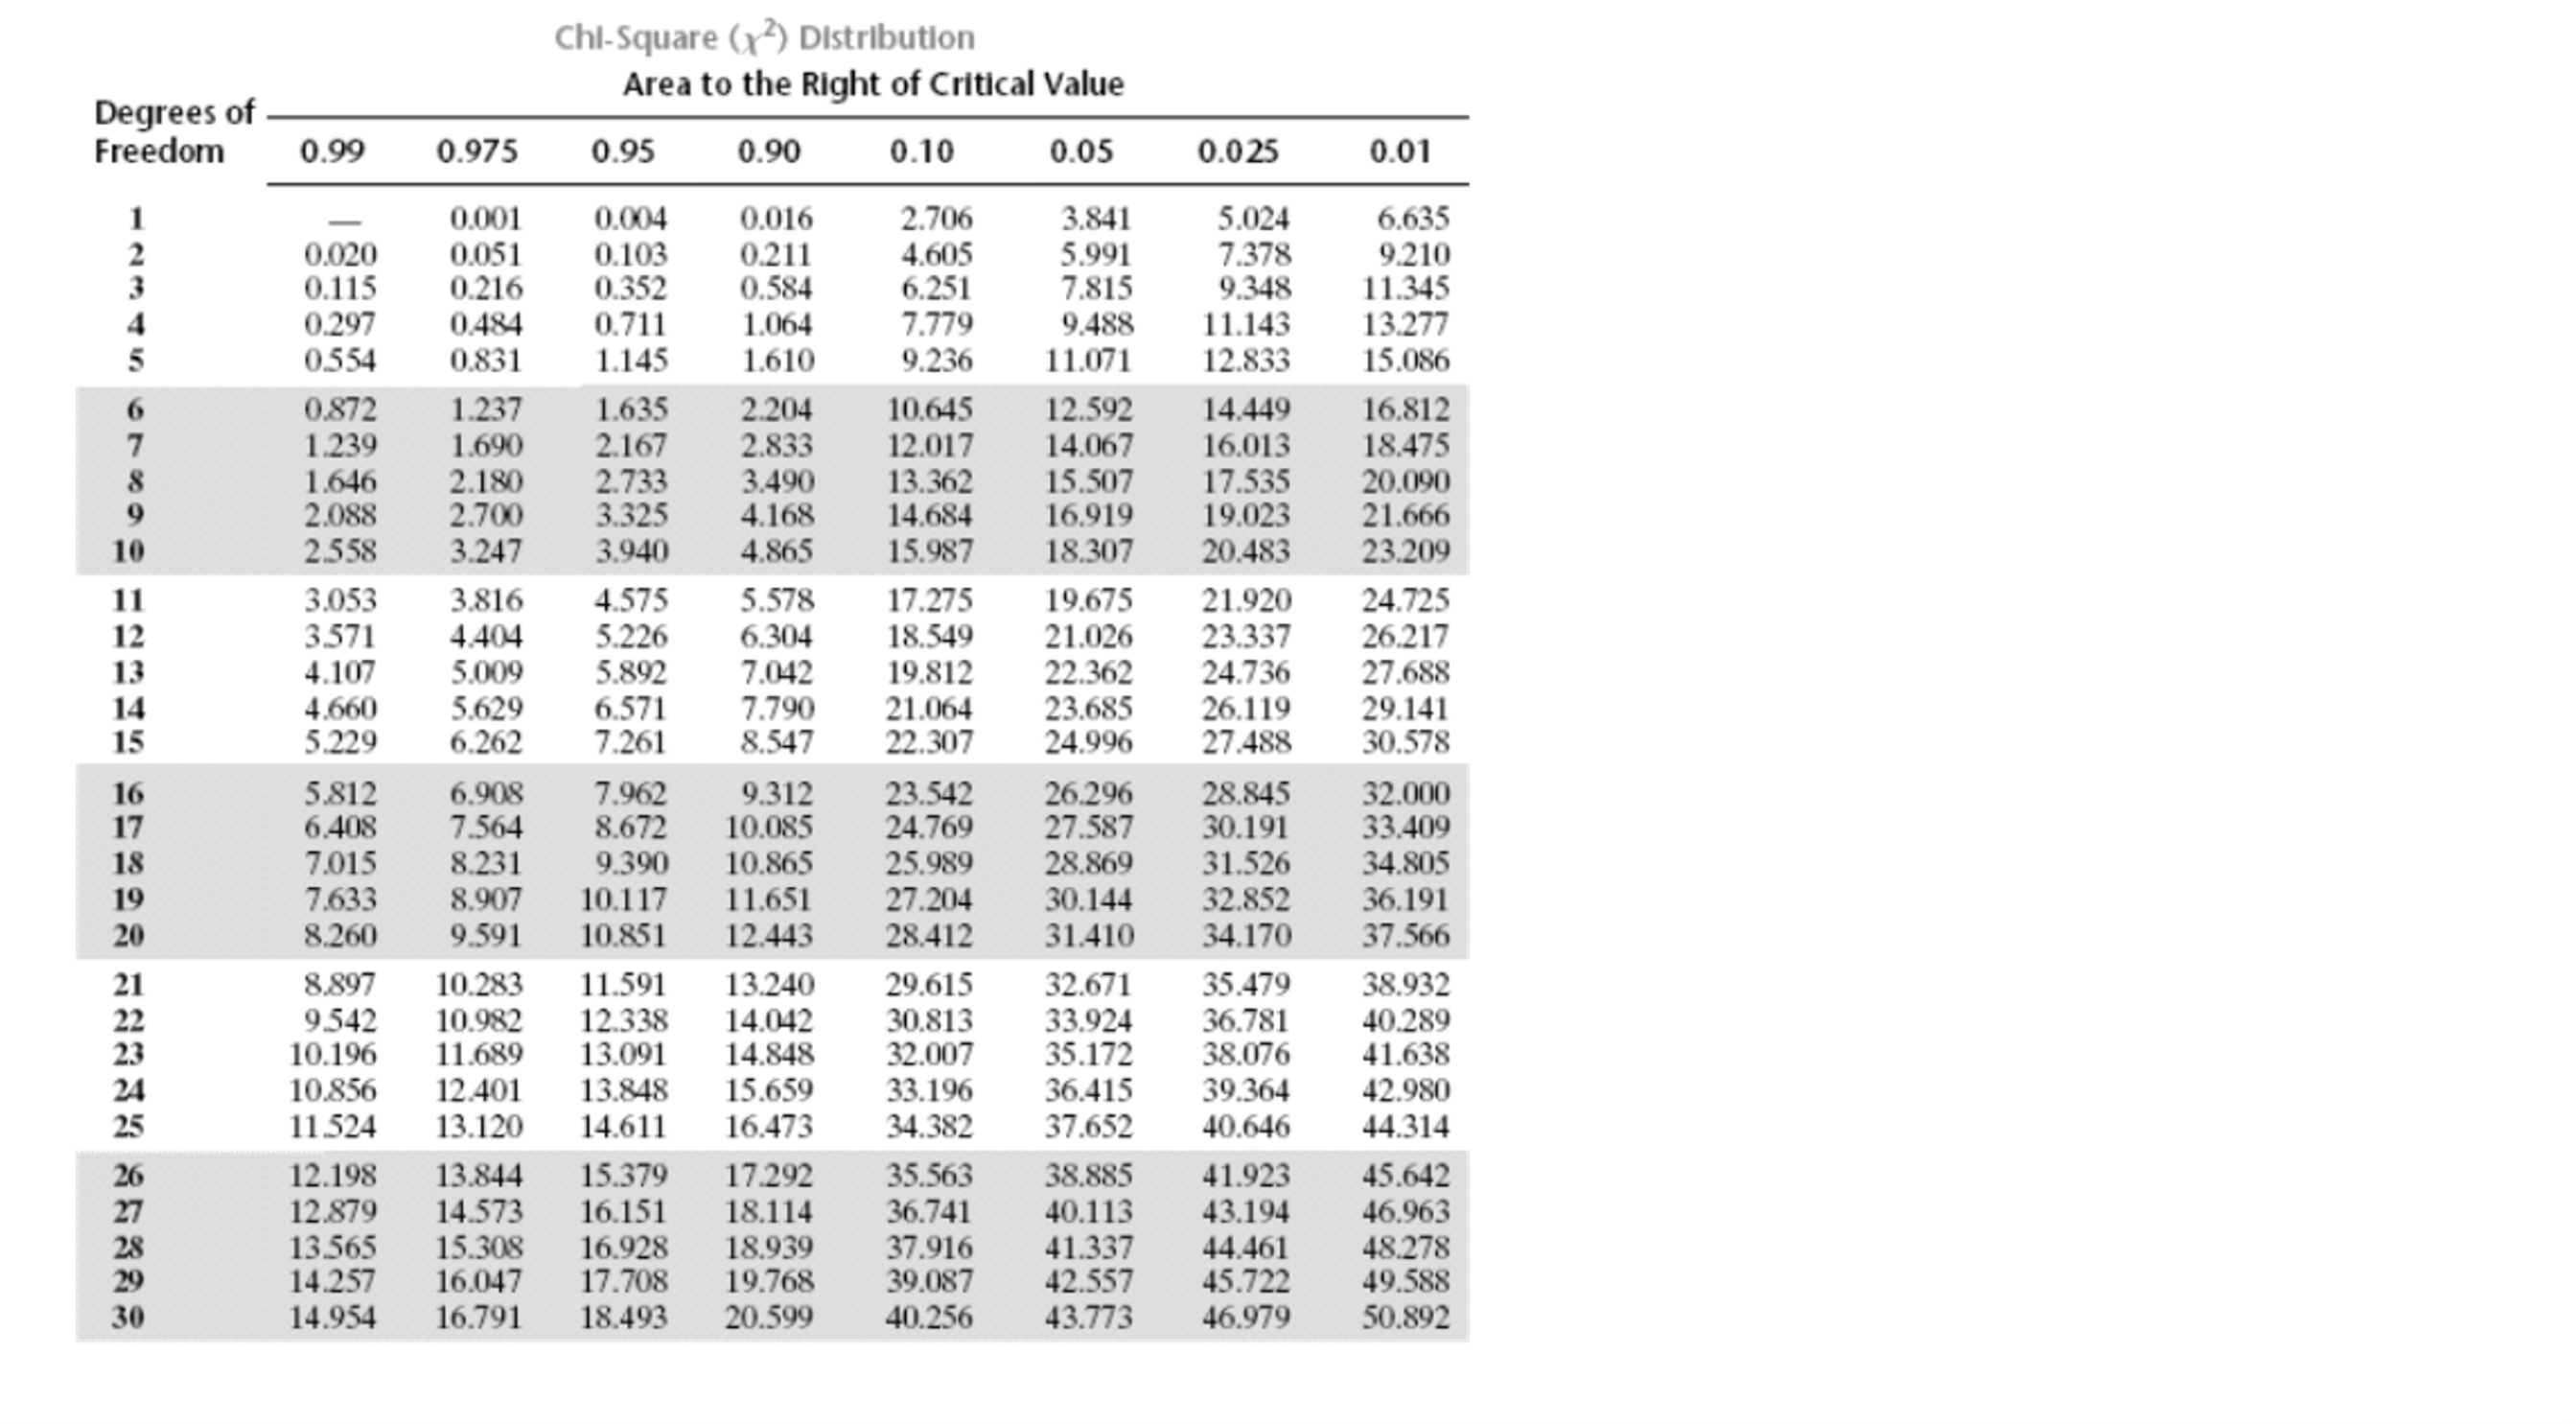
Use the chi square method.
Use 0.05 as the significance level.
Question:
Show your work and use the table to say whether the hypothesis was supported or rejected and why.
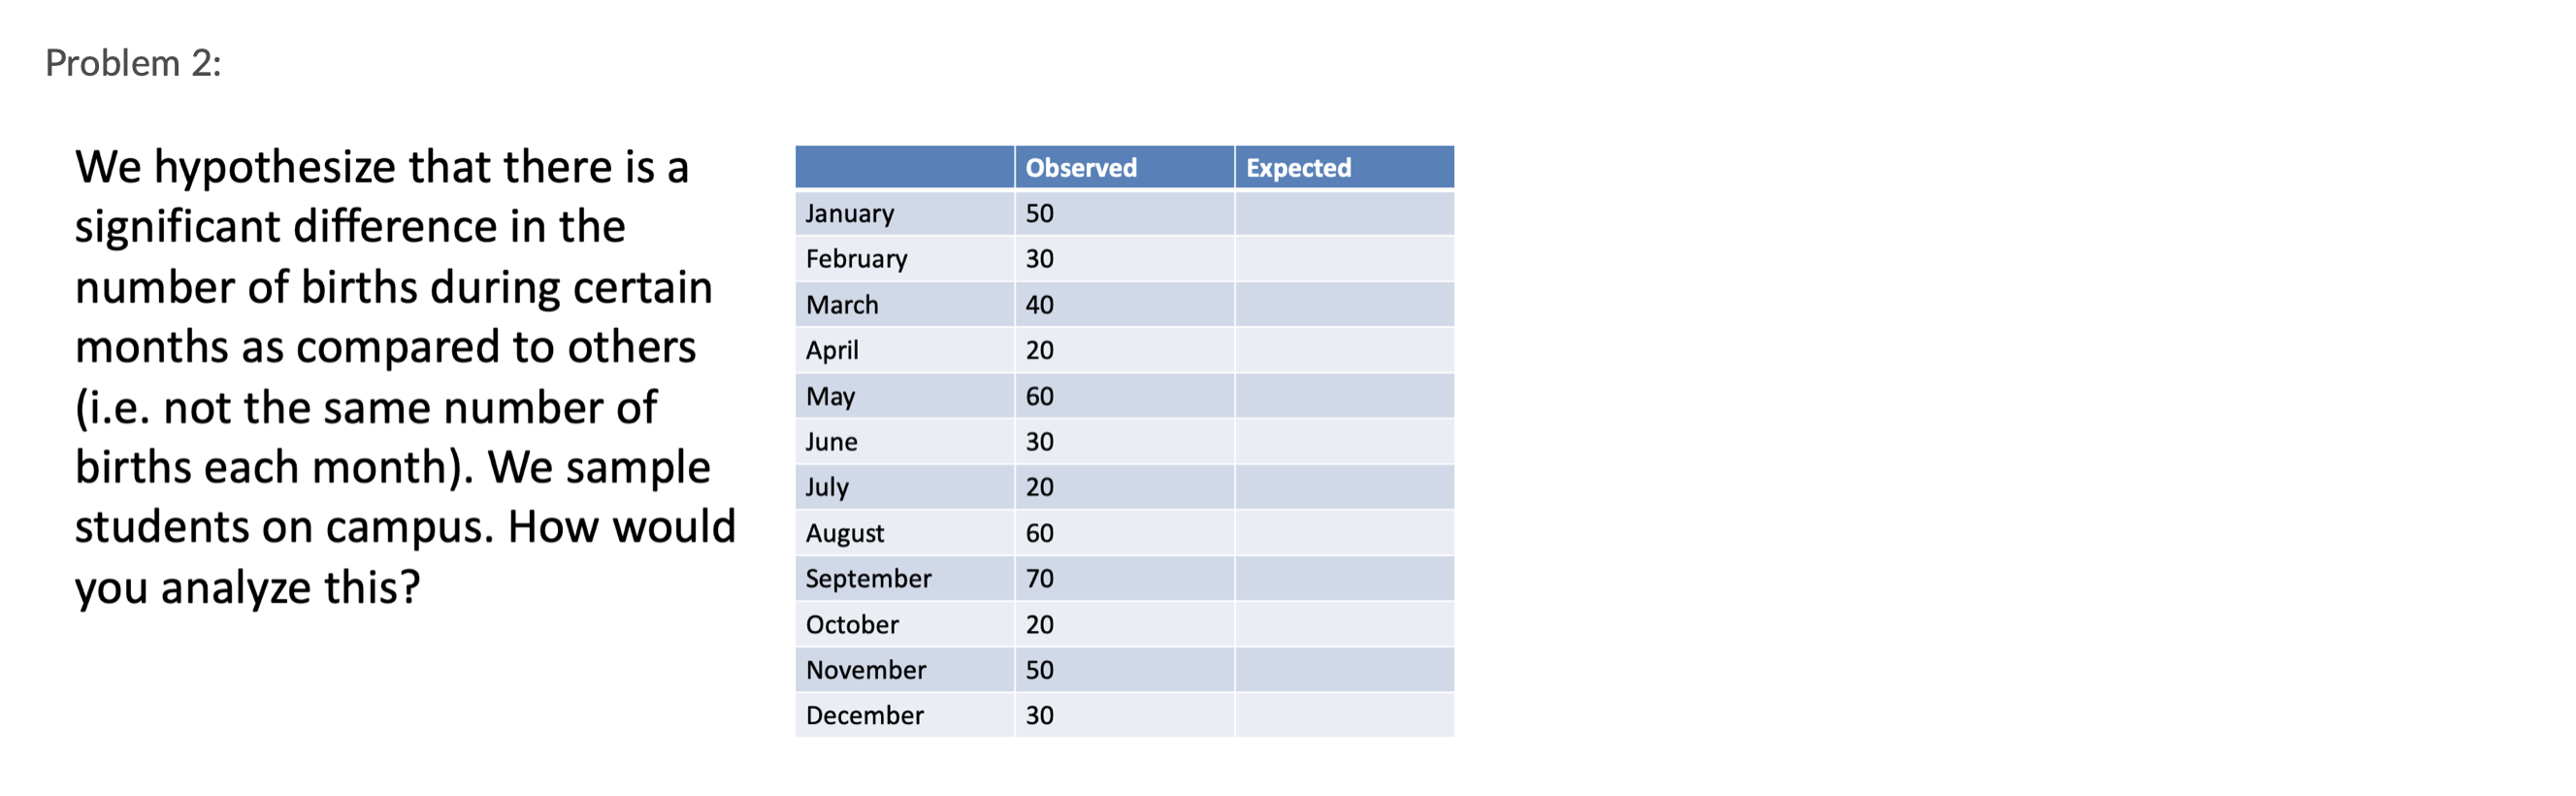
Chi-Square (12) Distribution Area to the Right of Critical Value Degrees of Freedom 0.99 0.975 0.95 0.90 0.10 0.05 0.025 0.01 0.001 0.004 0.016 2.706 3.841 5.024 6.635 0.020 0.051 0.103 0.211 4.605 5.991 7.378 9.210 MAWNE 0.115 0.216 0.352 0.584 6.251 7.815 9.348 11.345 0.297 0.484 0.711 1.064 7.779 9.488 11.143 13.277 0.554 0.831 1.145 1.610 9.236 11.071 12.833 15.086 0.872 1.237 1.635 2.204 10.645 12.592 14.449 16.812 1.239 1.690 2.167 2.833 12.017 14.067 16.013 18.475 1.646 2.180 2.733 3.490 13.362 15.507 17.535 20.090 2.088 2.700 3.325 4.168 14.684 16.919 19.023 21.666 2.558 3.247 3.940 4.865 15.987 18.307 20.483 23.209 3.053 3.816 4.575 5.578 17.275 19.675 21.920 24.725 3.571 4.404 5.226 6.304 18.549 21.026 23.337 26.217 4.107 5.009 5.892 7.042 19.812 22.362 24.736 27.688 4.660 5.629 6.571 7.790 21.064 23.685 26.119 29.141 15 5.229 6.262 7.261 8.547 22.307 24.996 27.488 30.578 5.812 6.908 7.962 9.312 23.542 26.296 28.845 32.000 6.408 7.564 8.672 10.085 24.769 27.587 30.191 33.409 7.015 8.231 9.390 10.865 25.989 28.869 31.526 34.805 7.633 8.907 10.117 11.651 27.204 30.144 32.852 36.191 20 8.260 9.591 10.851 12.443 28.412 31.410 34.170 37.566 8.897 10.283 11.591 13.240 29.615 32.671 35.479 38.932 9.542 10.982 12.338 14.042 30.813 33.924 36.781 40.289 10.196 11.689 13.091 14.848 32.007 35.172 38.076 41.638 10.856 12.401 13.848 15.659 33.196 36.415 39.364 42.980 11.524 13.120 14.611 16.473 34.382 37.652 40.646 44.314 12.198 13.844 15.379 17.292 35.563 38.885 41.923 45.642 12.879 14.573 16.151 18.114 36.741 40.113 43.194 46.963 13.565 15.308 16.928 18.939 37.916 41.337 44.461 48.278 14.257 16.047 17.708 19.768 39.087 42.557 45.722 49.588 14.954 16.791 18.493 20.599 40.256 43.773 46.979 50.892Problem 2: We hypothesize that there is a Observed Expected significant difference in the January 50 February 30 number of births during certain March 40 months as compared to others April 20 (i.e. not the same number of May 60 June 30 births each month). We sample July 20 students on campus. How would August 60 you analyze this? September 70 October 20 November 50 December 30