Answered step by step
Verified Expert Solution
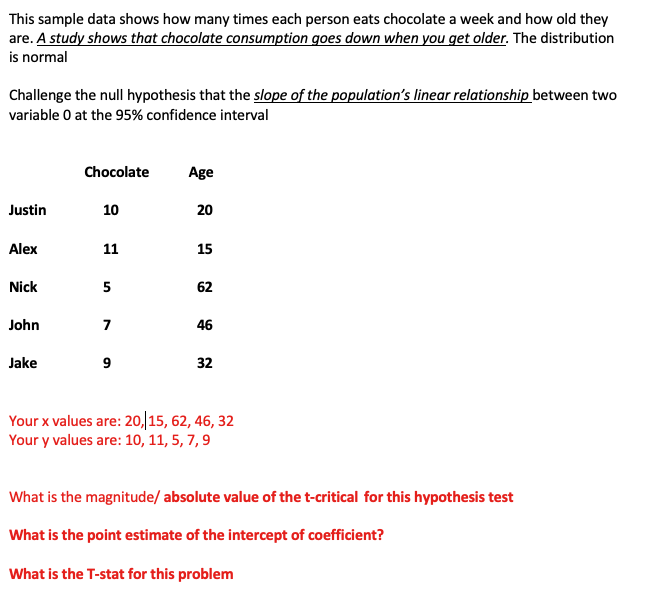
Link Copied!

Question

1 Approved Answer

Could you please show me the equations and numbers you used to get these answers. That would help so much. Thank you! This sample data

Could you please show me the equations and numbers you used to get these answers. That would help so much. Thank you!

image text in transcribed
This sample data shows how many times each person eats chocolate a week and how old they are. A study shows that chocolate consumption goes down when you get older. The distribution is normal Challenge the null hypothesis that the slope of the population's linear relationship between two variable 0 at the 95% confidence interval Chocolate Age Justin 10 20 Alex 11 15 Nick 5 62 John 46 Jake 32 Your x values are: 20, 15, 62, 46, 32 Your y values are: 10, 11, 5, 7, 9 What is the magnitude/ absolute value of the t-critical for this hypothesis test What is the point estimate of the intercept of coefficient? What is the T-stat for this

Step by Step Solution

There are 3 Steps involved in it

Step: 1

blur-text-image

Get Instant Access to Expert-Tailored Solutions

See step-by-step solutions with expert insights and AI powered tools for academic success

Step: 2

blur-text-image

Step: 3

blur-text-image

Ace Your Homework with AI

Get the answers you need in no time with our AI-driven, step-by-step assistance

Get Started

Recommended Textbook for

Beginning Algebra A Text/Workbook

Authors: Charles P McKeague

2nd Edition

1483271242, 9781483271248

More Books

Students also viewed these Mathematics questions

Question

General Purpose of Your Speech Analyzing Your Audience

Answered: 1 week ago

Question

Ethical Speaking: Taking Responsibility for Your Speech?

Answered: 1 week ago