Question
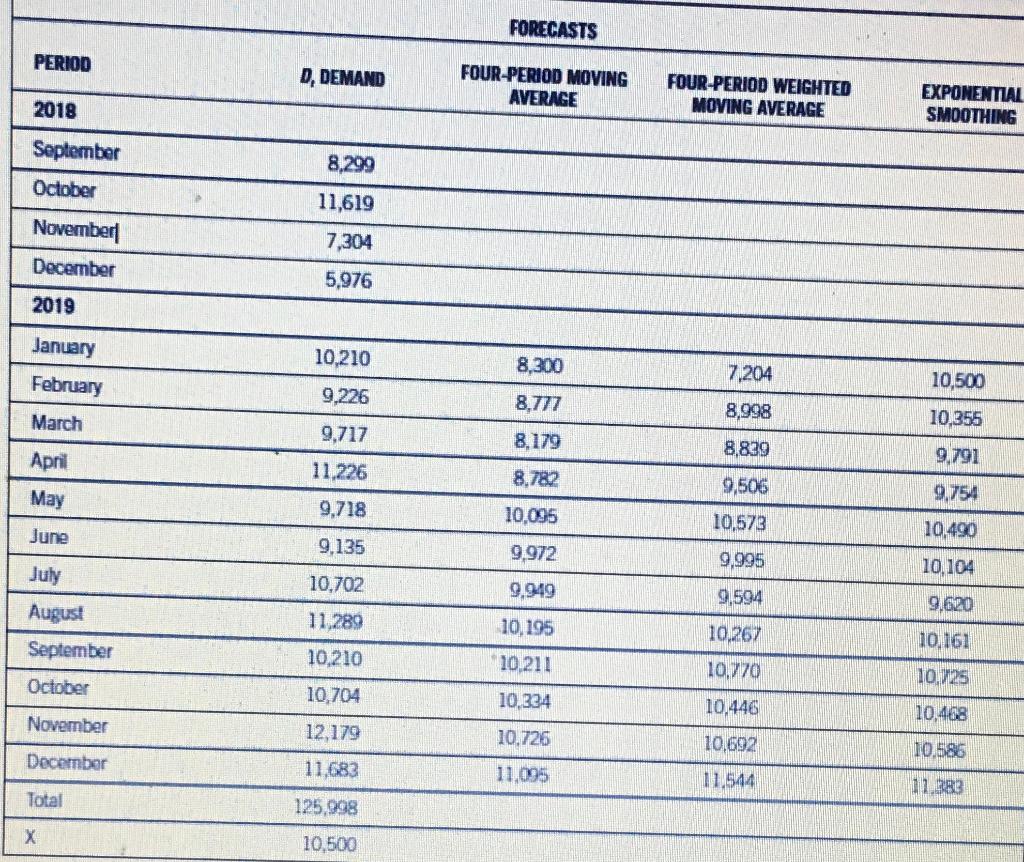
Course Title:-Supply Chain Case Study Instructions and Questions: 1. Thoroughly review the reading materials to gain a comprehensive understanding of three forecasting models, the calculation
Course Title:-Supply Chain Case Study
Instructions and Questions:
1. Thoroughly review the reading materials to gain a comprehensive understanding of three forecasting models, the calculation of forecast errors, and how to interpret forecast accuracy.
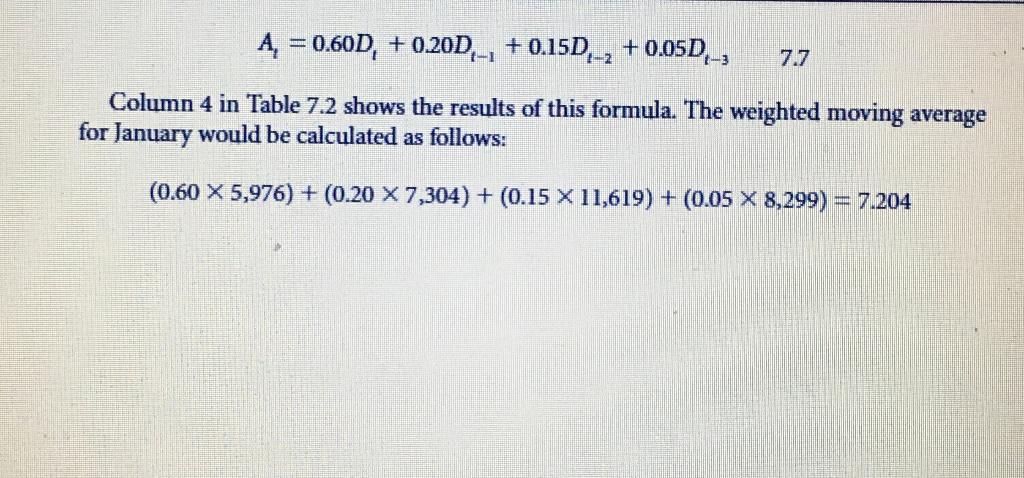
2. Utilizing the 2021 Demand Table, Firstly, calculate forecasts using the Simple Moving Average (4 periods) from Table 7.3, the Weighted Moving Average from Table 7.4, and Exponential Smoothing from Table 7.5 with the the weights (0.5, 0.3, 0.15, 0.05) and a smoothing factor-alpha of 0.4.
3. Then, use three periods for the Simple Moving Average and the Weighted Moving Average, using weights of 0.6, 0.3, and 0.1. For the Exponential Smoothing forecast, use a smoothing factor-alpha of 0.3. Compare the forecast errors using different periods and weight/alpha settings.
4. Compute the Forecast Accuracy Summary in Table 7.6.
5. You will submit your project with at least four tables, like Table 7.3 Table 7.6 or any appropriate format to meet our purpose, and then some comparison between Step 2 and Step 3.

 6. Finally, let me know your challenges when calculating the forecast.
Step by Step Solution
There are 3 Steps involved in it
Step: 1

Get Instant Access to Expert-Tailored Solutions
See step-by-step solutions with expert insights and AI powered tools for academic success
Step: 2

Step: 3

Ace Your Homework with AI
Get the answers you need in no time with our AI-driven, step-by-step assistance
Get Started


