Answered step by step
Verified Expert Solution
Question
1 Approved Answer
Crane Appliances Corporation has reported its financial results for the year ended December 31, 2017. Crane Appliances Corporation Income Statement for the Fiscal Year Ended
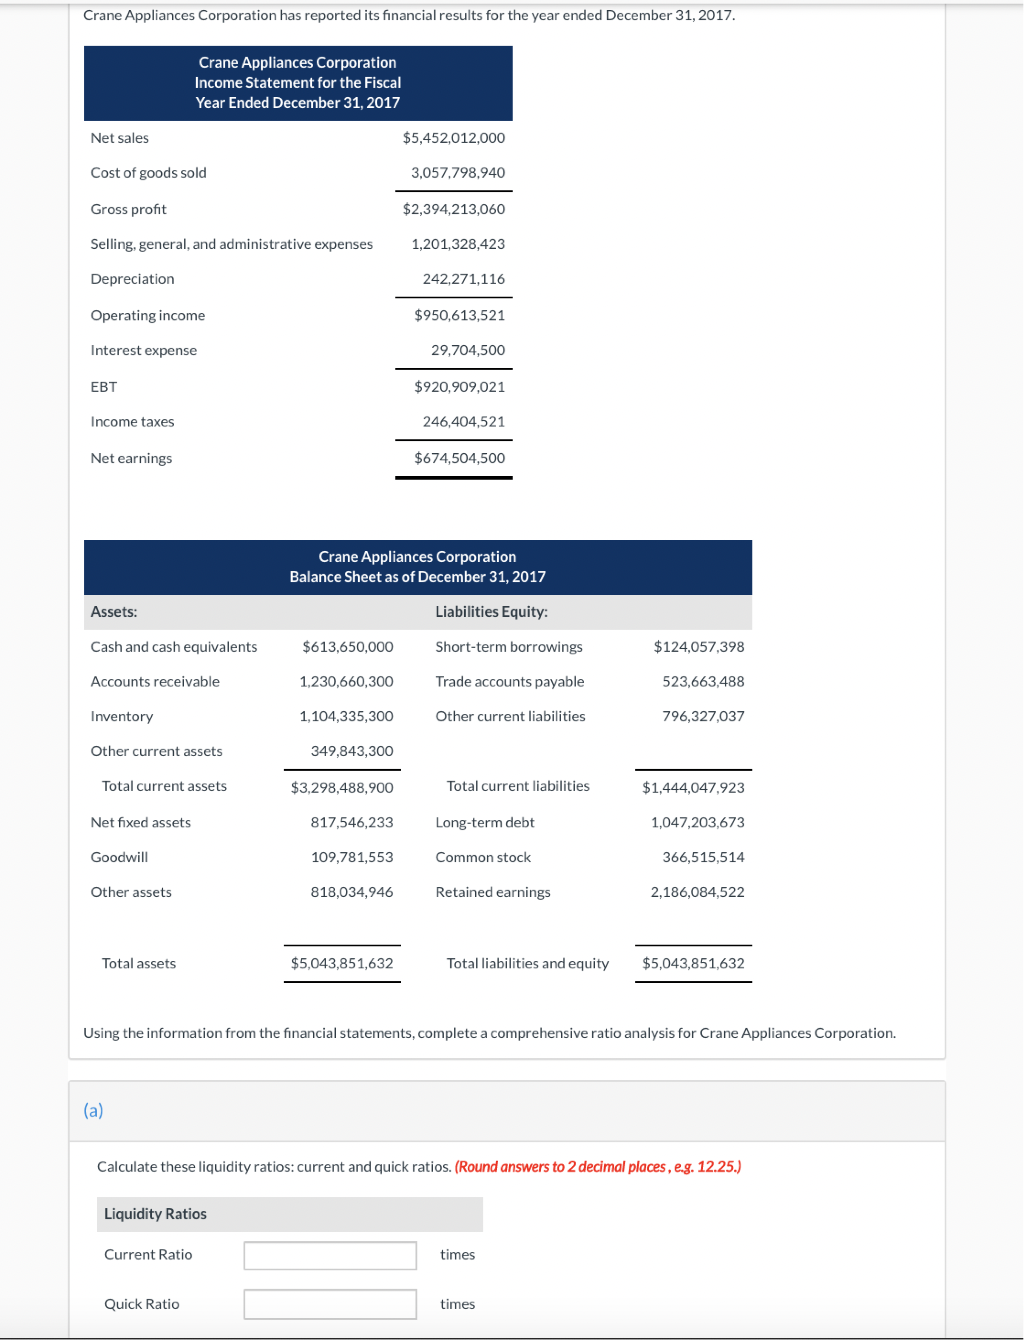
Crane Appliances Corporation has reported its financial results for the year ended December 31, 2017. Crane Appliances Corporation Income Statement for the Fiscal Year Ended December 31, 2017 Net sales $5,452,012,000 Cost of goods sold 3,057.798,940 Gross profit $2,394, 213,060 Selling, general, and administrative expenses 1,201,328,423 Depreciation 242,271,116 Operating income $950,613,521 Interest expense 29,704,500 EBT $920,909,021 Income taxes 246,404,521 Net earnings $674,504,500 Crane Appliances Corporation Balance Sheet as of December 31, 2017 Assets: Liabilities Equity: Cash and cash equivalents $613,650,000 Short-term borrowings $124,057,398 Accounts receivable 1.230,660,300 Trade accounts payable 523,663,488 Inventory 1,104,335,300 Other current liabilities 796,327,037 Other current assets 349,843,300 Total current assets $3,298,488,900 Total current liabilities $1,444,047,923 Net fixed assets 817,546,233 Long-term debt 1,047,203,673 Goodwill 109,781,553 Common stock 366,515,514 Other assets 818,034,946 Retained earnings 2,186,084,522 Total assets $5,043,851,632 Total liabilities and equity $5,043,851,632 $ Using the information from the financial statements, complete a comprehensive ratio analysis for Crane Appliances Corporation. (a) Calculate these liquidity ratios: current and quick ratios. (Round answers to 2 decimal places, e.g. 12.25.) Liquidity Ratios Current Ratio times Quick Ratio times
Step by Step Solution
There are 3 Steps involved in it
Step: 1
Get Instant Access to Expert-Tailored Solutions
See step-by-step solutions with expert insights and AI powered tools for academic success
Step: 2
Step: 3
Ace Your Homework with AI
Get the answers you need in no time with our AI-driven, step-by-step assistance
Get Started