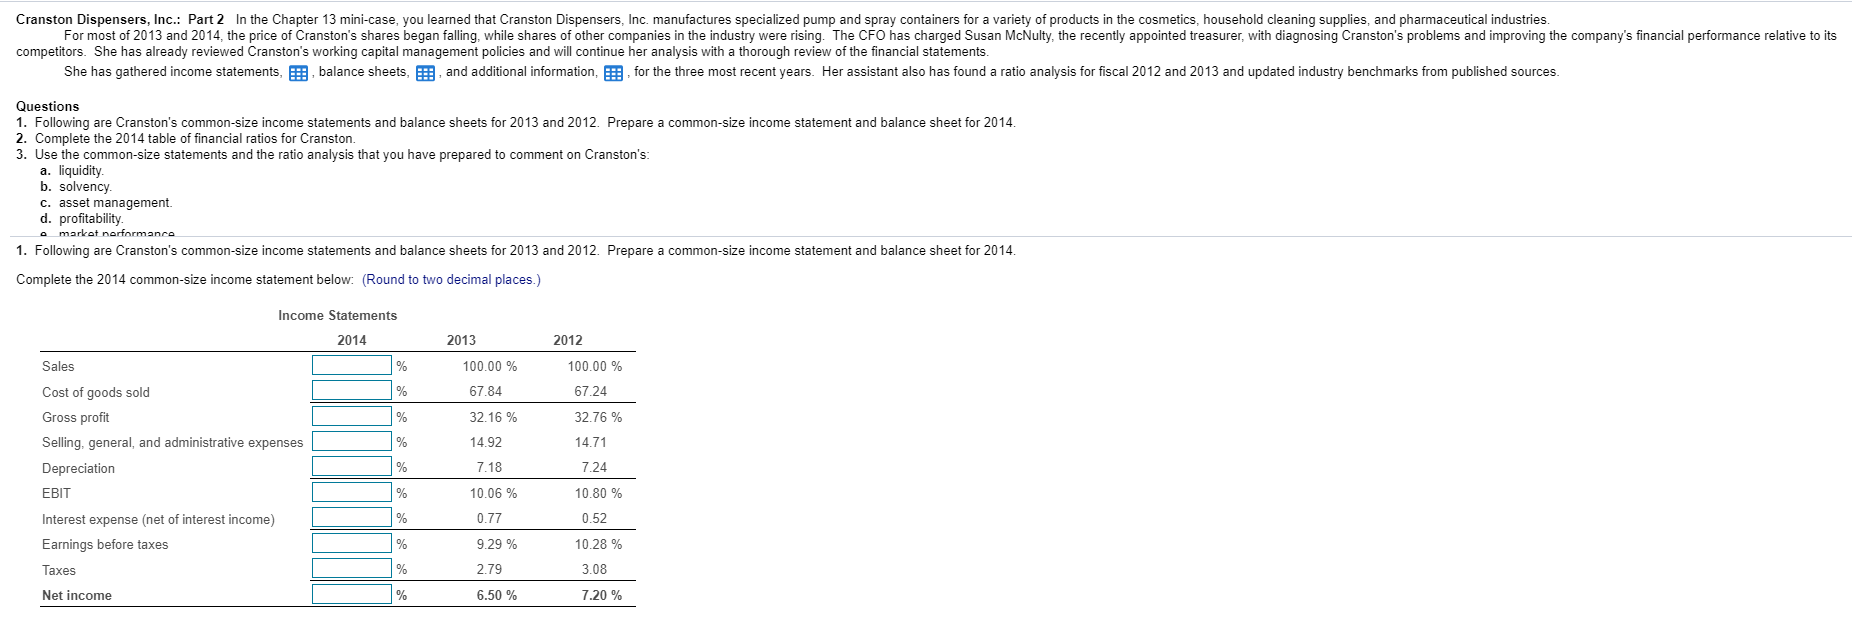
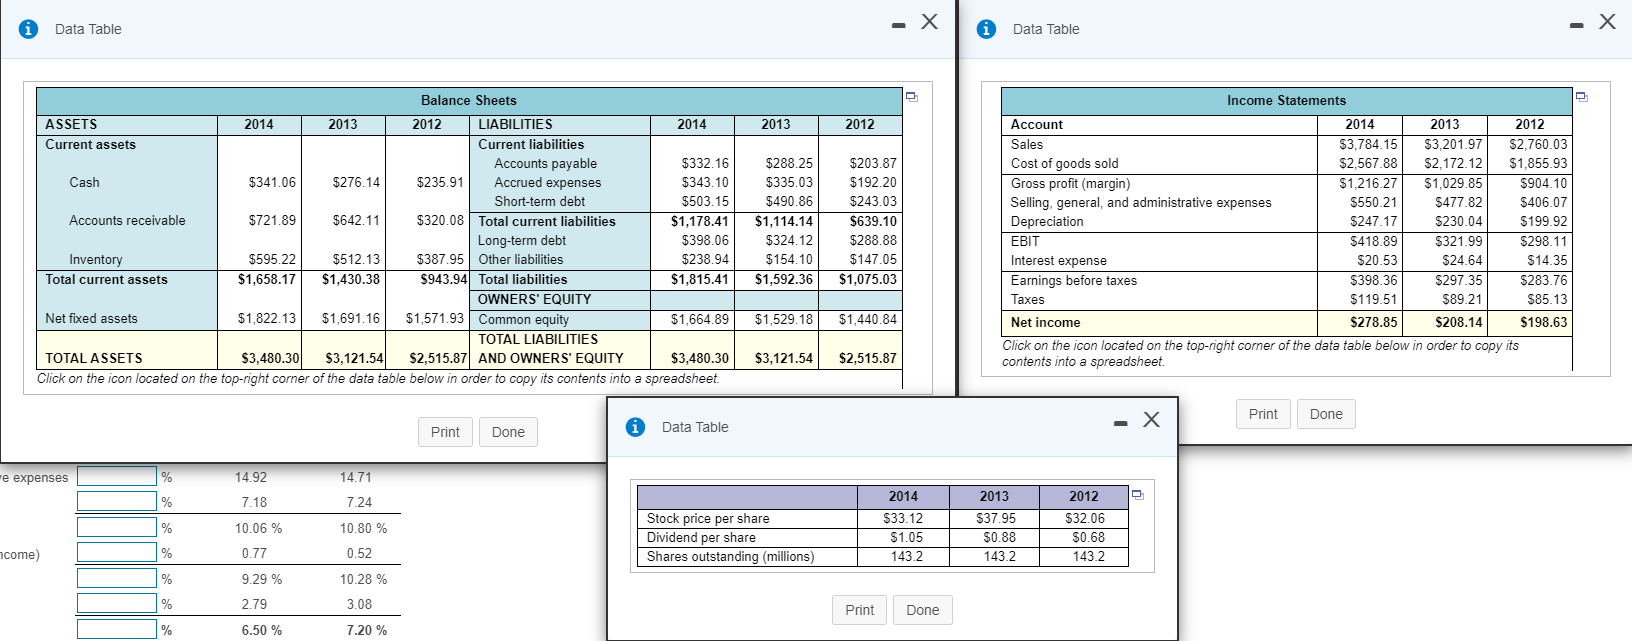
Cranston Dispensers, Inc.: Part 2 In the Chapter 13 mini-case, you learned that Cranston Dispensers, Inc. manufactures specialized pump and spray containers for a variety of products in the cosmetics, household cleaning supplies, and pharmaceutical industries. For most of 2013 and 2014, the price of Cranston's shares began falling, while shares of other companies in the industry were rising. The CFO has charged Susan McNulty, the recently appointed treasurer with diagnosing Cranston's problems and improving the company's financial performance relative to its competitors. She has already reviewed Cranston's working capital management policies and will continue her analysis with a thorough review of the financial statements. She has gathered income statements, balance sheets, and additional information, for the three most recent years. Her assistant also has found a ratio analysis for fiscal 2012 and 2013 and updated industry benchmarks from published sources. Questions 1. Following are Cranston's common-size income statements and balance sheets for 2013 and 2012. Prepare common-size income statement and balance sheet for 2014. 2. Complete the 2014 table of financial ratios for Cranston. 3. Use the common-size statements and the ratio analysis that you have prepared to comment on Cranston's: a. liquidity b. solvency. c. asset management. d. profitability a market nerformance 1. Following are Cranston's common-size income statements and balance sheets for 2013 and 2012. Prepare a common-size income statement and balance sheet for 2014. Complete the 2014 common-size income statement below. (Round to two decimal places.) Income Statements 2014 2013 2012 Sales % 100.00 % 100.00 % % 67.84 67.24 % 32.16 % 32.76 % Cost of goods sold Gross profit Selling, general, and administrative expenses Depreciation EBIT % 14.92 14.71 % 7.18 7.24 % 10.06 % 10.80 % % 0.77 0.52 Interest expense (net of interest income) Earnings before taxes Taxes % 9.29 % 10.28 % % 2.79 3.08 Net income % 6.50 % 7.20 % Data Table Data Table Balance Sheets 2013 2012 $642.11 ASSETS 2014 2013 2012 LIABILITIES 2014 Current assets Current liabilities Accounts payable $332.16 Cash $341.06 $276.14 $235.91 Accrued expenses $343.10 Short-term debt $503.15 Accounts receivable $721.89 $320.08 Total current liabilities $1,178.41 Long-term debt $398.06 Inventory $595.22 $512.13 $387.95 Other liabilities $238.94 Total current assets $1,658.17 $1,430.38 $943.94 Total liabilities $1,815.41 OWNERS' EQUITY Net fixed assets $1,822.13 $1,691.16 $1,571.93 Common equity $1,664.89 TOTAL LIABILITIES TOTAL ASSETS $3,480.30 $3,121.54 $2,515.87 AND OWNERS' EQUITY $3,480.30 Click on the icon located on the top-right corner of the data table below in order to copy its contents into a spreadsheet. $288.25 $335.03 $490.86 $1,114.14 $324.12 $154.10 $1,592.36 $203.87 $192.20 $243.03 $639.10 $288.88 $147.05 $1.075.03 $247.17 Income Statements Account 2014 2013 2012 Sales $3,784.15 $3,201.97 $2,760.03 Cost of goods sold $2,567.88 $2,172.12 $1,855.93 Gross profit (margin) $1,216.27 $1.029.85 $904.10 Selling, general, and administrative expenses $550.21 $477.82 $406.07 Depreciation $230.04 $199.92 EBIT $418.89 $321.99 $298.11 Interest expense $20.53 $24.64 $14.35 Earnings before taxes $398.36 $297.35 $283.76 Taxes $119.51 $89.21 $85.13 Net income $278.85 $208.14 $198.63 Click on the icon located on the top-right corner of the data table below in order to copy its contents into a spreadsheet. $1,529.18 $1,440.84 $3,121.54 $2,515.87 - X Print Done Print Done Data Table me expenses % 14.92 14.71 % 7.18 7.24 % 10.06 % 10.80 % Stock price per share Dividend per share Shares outstanding (millions) 2014 $33.12 $1.05 143.2 2013 $37.95 $0.88 143.2 2012 $32.06 $0.68 143.2 ncome) % 0.77 0.52 % 9.29 % 10.28 % % 2.79 3.08 Print Done % 6.50 % 7.20%