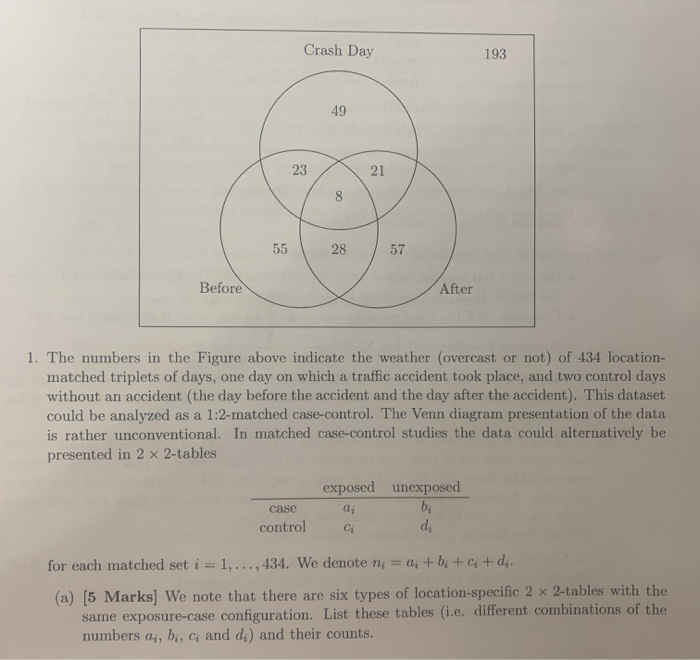
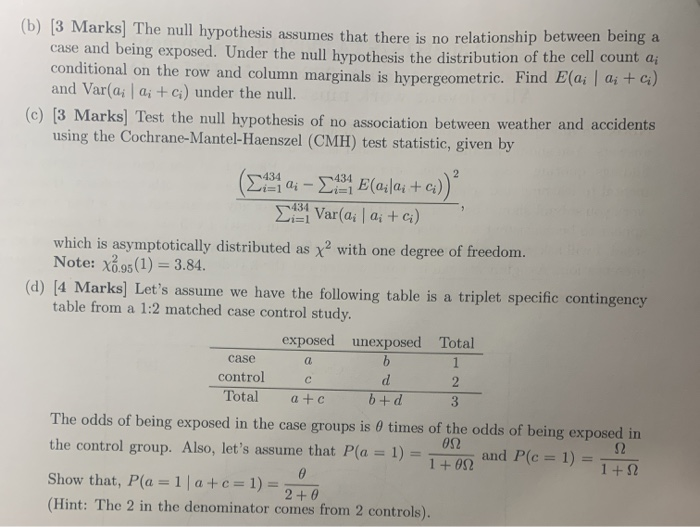
Crash Day 193 49 23 21 55 28 57 Before After 1. The numbers in the Figure above indicate the weather (overcast or not) of 434 location- matched triplets of days, one day on which a traffic accident took place, and two control days without an accident (the day before the accident and the day after the accident). This dataset could be analyzed as a 1:2-matched case-control. The Venn diagram presentation of the data is rather unconventional. In matched case-control studies the data could alternatively be presented in 2 x 2-tables case control exposed unexposed aj bi di for each matched set i = 1, ..., 434. We denote ni = 0; +b; +ci+di. (a) [5 Marks) We note that there are six types of location-specific 2 x 2-tables with the same exposure-case configuration. List these tables (i.e. different combinations of the numbers ai, bi, ci and d) and their counts. (b) [3 Marks] The null hypothesis assumes that there is no relationship between being a case and being exposed. Under the null hypothesis the distribution of the cell count di conditional on the row and column marginals is hypergeometric. Find Elai | ai + c) and Vara: 0; + c) under the null. (c) (3 Marks] Test the null hypothesis of no association between weather and accidents using the Cochrane-Mantel-Haenszel (CMH) test statistic, given by 2 Distai - 21 E(qj|ai + C) 2:31 Var(ai | a; +ci) which is asymptotically distributed as x2 with one degree of freedom. Note: x 95(1) = 3.84. (d) [4 Marks) Let's assume we have the following table is a triplet specific contingency table from a 1:2 matched case control study. exposed unexposed Total b 1 control d 2 Total atc b+d 3 The odds of being exposed in the case groups is 0 times of the odds of being exposed in 092 12 the control group. Also, let's assume that P(a = 1) = 1 + 022 and P(c = 1) = e 1 +2 Show that, P(a = 1 a+c= 1) = 2 + 0 (Hint: The 2 in the denominator comes from 2 controls). case (2 Crash Day 193 49 23 21 55 28 57 Before After 1. The numbers in the Figure above indicate the weather (overcast or not) of 434 location- matched triplets of days, one day on which a traffic accident took place, and two control days without an accident (the day before the accident and the day after the accident). This dataset could be analyzed as a 1:2-matched case-control. The Venn diagram presentation of the data is rather unconventional. In matched case-control studies the data could alternatively be presented in 2 x 2-tables case control exposed unexposed aj bi di for each matched set i = 1, ..., 434. We denote ni = 0; +b; +ci+di. (a) [5 Marks) We note that there are six types of location-specific 2 x 2-tables with the same exposure-case configuration. List these tables (i.e. different combinations of the numbers ai, bi, ci and d) and their counts. (b) [3 Marks] The null hypothesis assumes that there is no relationship between being a case and being exposed. Under the null hypothesis the distribution of the cell count di conditional on the row and column marginals is hypergeometric. Find Elai | ai + c) and Vara: 0; + c) under the null. (c) (3 Marks] Test the null hypothesis of no association between weather and accidents using the Cochrane-Mantel-Haenszel (CMH) test statistic, given by 2 Distai - 21 E(qj|ai + C) 2:31 Var(ai | a; +ci) which is asymptotically distributed as x2 with one degree of freedom. Note: x 95(1) = 3.84. (d) [4 Marks) Let's assume we have the following table is a triplet specific contingency table from a 1:2 matched case control study. exposed unexposed Total b 1 control d 2 Total atc b+d 3 The odds of being exposed in the case groups is 0 times of the odds of being exposed in 092 12 the control group. Also, let's assume that P(a = 1) = 1 + 022 and P(c = 1) = e 1 +2 Show that, P(a = 1 a+c= 1) = 2 + 0 (Hint: The 2 in the denominator comes from 2 controls). case (2


