

Answered step by step
Verified Expert Solution
Question
1 Approved Answer
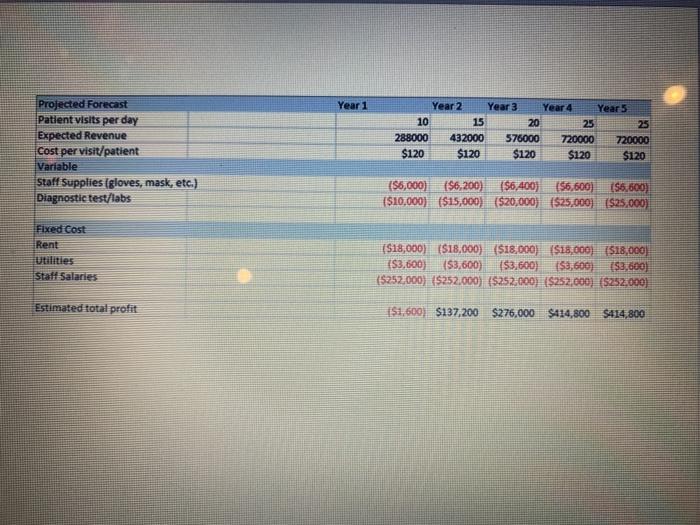
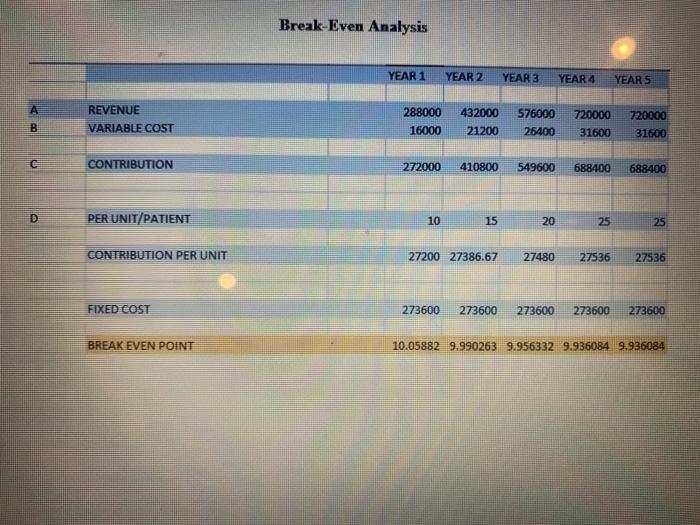
Create a Balance sheet just need a balance sheet created from the information 12:02 LTE 132,000 income Statement Revenu Staff Supplies (gloves, mas Diagnostics Gross
Create a Balance sheet 
just need a balance sheet created from the information
12:02 LTE 132,000 income Statement Revenu Staff Supplies (gloves, mas Diagnostics Gross Profit 720.000 A.NO 2.000 -6,000 10. 272.000 576.000 4,400 20.000 549.00 20.000 AMO 25.000 688.00 -15.000 410.00 68.00 Lo sporty Rece Utilities Staff Sales -18.000 -3.00 -252.000 -18.000 -3.800 -18.000 3.000 352000 3. -352 Net Profile -1.400 199 200 276,000 414 414 Year 1 Projected Forecast Patient visits per day Expected Revenue Cost per visit/patient Variable Staff Supplies (gloves, mask, etc.) Diagnostic test/labs Year 2 Year 3 Year 4 Year 5 10 15 20 25 25 288000 432000 576000 720000 720000 $120 $120 $120 $120 $120 ($6,000) (56,200) ($6,400) (55.600) (56.600) ($10,000) ($15,000) ($20,000) $25,000) ($25.000) Fixed Cost Rent Utilities Staff Salaries ($18,000) ($18,000) ($18,000) ($18,000) ($18,000) 153.600) (53.600) 153,600) ($3,600) $3,600) (5252,000) (5252.000) (5252.000) ($252.000) (5252,000) Estimated total profit $1,600) $137,200 $275,000 $414,800 $414,800 Break-Even Analysis YEAR 1 YEAR 2 YEAR 3 YEAR 4 YEAR 5 A REVENUE VARIABLE COST 288000 16000 432000 21200 576000 26400 8 720000 31600 720000 31600 C CONTRIBUTION 272000 410800 549600 688400 688400 D PER UNIT/PATIENT 10 15 20 25 25 CONTRIBUTION PER UNIT 27200 27386.67 27480 27536 27536 FIXED COST 273600 273600 273600 273600 273600 BREAK EVEN POINT 10.05882 9.990263 9.956332 9.936084 9.936084 12:02 LTE 132,000 income Statement Revenu Staff Supplies (gloves, mas Diagnostics Gross Profit 720.000 A.NO 2.000 -6,000 10. 272.000 576.000 4,400 20.000 549.00 20.000 AMO 25.000 688.00 -15.000 410.00 68.00 Lo sporty Rece Utilities Staff Sales -18.000 -3.00 -252.000 -18.000 -3.800 -18.000 3.000 352000 3. -352 Net Profile -1.400 199 200 276,000 414 414 Year 1 Projected Forecast Patient visits per day Expected Revenue Cost per visit/patient Variable Staff Supplies (gloves, mask, etc.) Diagnostic test/labs Year 2 Year 3 Year 4 Year 5 10 15 20 25 25 288000 432000 576000 720000 720000 $120 $120 $120 $120 $120 ($6,000) (56,200) ($6,400) (55.600) (56.600) ($10,000) ($15,000) ($20,000) $25,000) ($25.000) Fixed Cost Rent Utilities Staff Salaries ($18,000) ($18,000) ($18,000) ($18,000) ($18,000) 153.600) (53.600) 153,600) ($3,600) $3,600) (5252,000) (5252.000) (5252.000) ($252.000) (5252,000) Estimated total profit $1,600) $137,200 $275,000 $414,800 $414,800 Break-Even Analysis YEAR 1 YEAR 2 YEAR 3 YEAR 4 YEAR 5 A REVENUE VARIABLE COST 288000 16000 432000 21200 576000 26400 8 720000 31600 720000 31600 C CONTRIBUTION 272000 410800 549600 688400 688400 D PER UNIT/PATIENT 10 15 20 25 25 CONTRIBUTION PER UNIT 27200 27386.67 27480 27536 27536 FIXED COST 273600 273600 273600 273600 273600 BREAK EVEN POINT 10.05882 9.990263 9.956332 9.936084 9.936084 Step by Step Solution
There are 3 Steps involved in it
Step: 1

Get Instant Access to Expert-Tailored Solutions
See step-by-step solutions with expert insights and AI powered tools for academic success
Step: 2

Step: 3
Ace Your Homework with AI
Get the answers you need in no time with our AI-driven, step-by-step assistance
Get Started
Multinational Business Finance
Authors: David K. Eiteman, Arthur I. Stonehill, Michael H. Moffett
16th Edition
013749601X, 978-0137496013