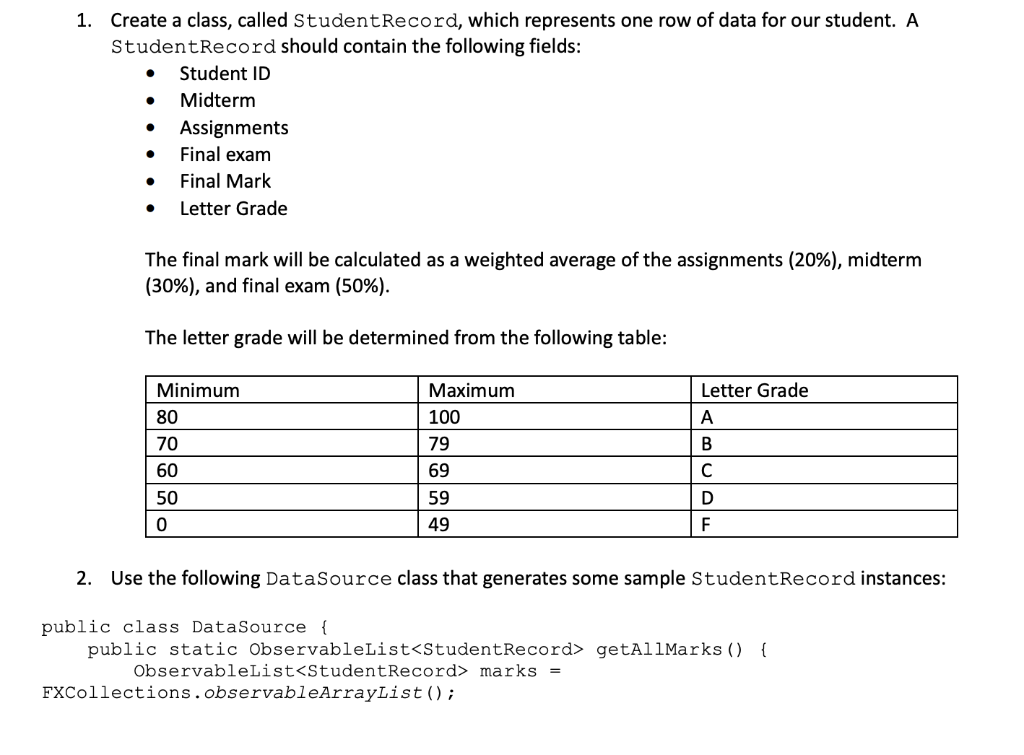
Create a class, called StudentRecord, which represents one row of data for our student. A StudentRecord should contain the following fields: 1. . Student ID Midterm * Assignments Final exam Final Mark . Letter Grade The final mark will be calculated as a weighted average of the assignments (20%), midterm (30%), and final exam (50%). The letter grade will be determined from the following table: Minimum 80 70 60 50 0 Maximum 100 79 69 59 49 Letter Grade 2. Use the following DataSource class that generates some sample StudentRecord instances: public class DataSource public static ObservableList
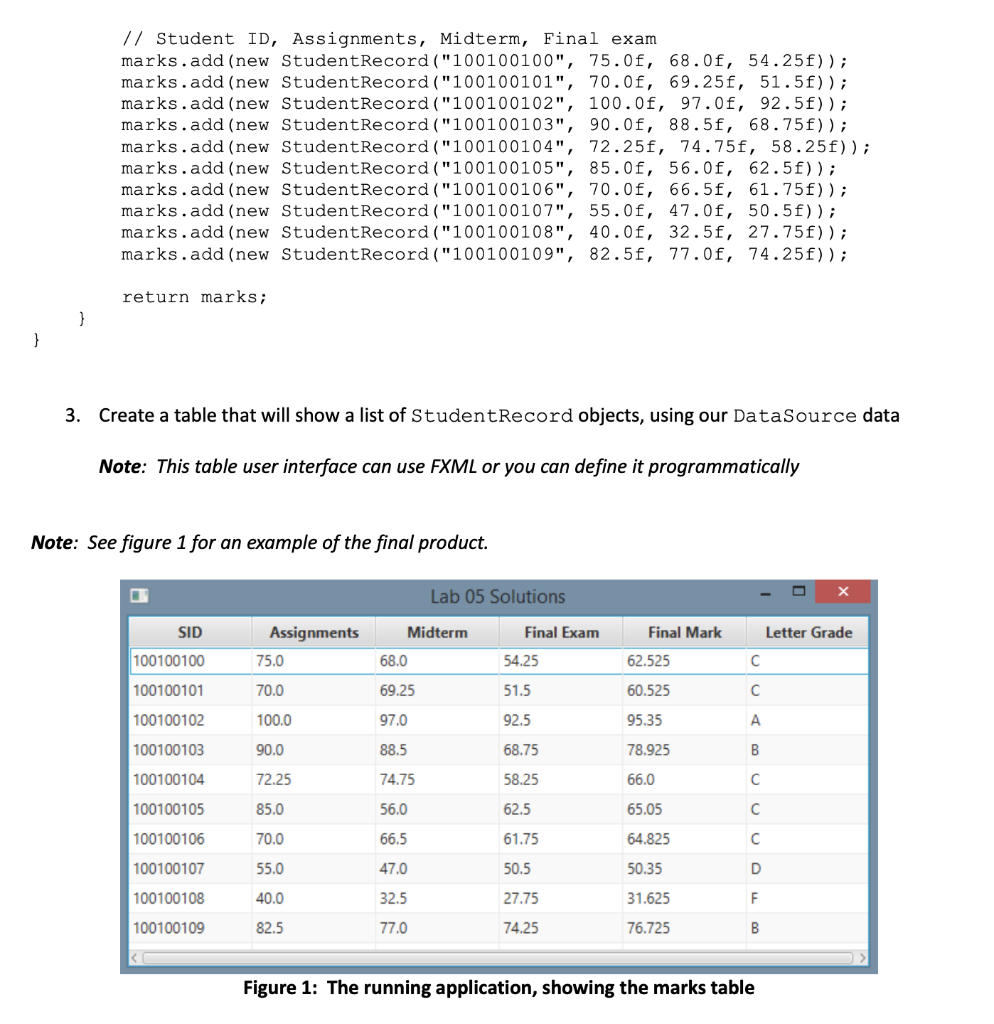
getAllMarks observableListCStudentRecord> marks = FXCollections.observableArrayList ) // Student ID, Assignments, Midterm, Final exam marks.add (new StudentRecord ("100100100", 75.0f, 68.0f, 54.25f)) marks.add (new StudentRecord ("100100101", 70.Of, 69.25f, 51.5f)) marks.add (new StudentRecord ("100100102", 100.0f, 97.0f, 92.5f)) marks.add (new StudentRecord ("100100103", 90.0f, 88.5f, 68.75f)) marks.add (new StudentRecord("100100104", 72.25f, 74.75f, 58.25f) marks.add (new StudentRecord ("100100105", 85.Of, 56.0f, 62.5f)) marks.add (new StudentRecord ("100100106", 70.0f, 66.5f, 61.75f)); marks.add (new StudentRecord ("100100107", 55.0f, 47.0f, 50.5f)) marks.add (new StudentRecord ("100100108", 40.Of, 32.5f, 27.75f)) marks.add (new StudentRecord ("100100109", 82.5f, 77.0f, 74.25f)) return marks; 3. Create a table that will show a list of StudentRecord objects, using our DataSource data Note: This table user interface can use FXML or you can define it programmatically Note: See figure 1 for an example of the final product Lab 05 Solutions Final Exanm 54.25 51.5 92.5 68.75 SID 100100100 100100101 100100102 100100103 100100104 100100105 100100106 100100107 100100108 100100109 Final Mark 62.525 60.525 95.35 78.925 66.0 65.05 64.825 50.35 31.625 76.725 Assignments 75.0 70.0 100.0 90.0 Midterm Letter Grade 68.0 69.25 97.0 88.5 74.75 56.0 66.5 47.0 32.5 77.0 85.0 70.0 55.0 40.0 82.5 62.5 50.5 27.75 74.25 Figure 1: The running application, showing the marks table Create a class, called StudentRecord, which represents one row of data for our student. A StudentRecord should contain the following fields: 1. . Student ID Midterm * Assignments Final exam Final Mark . Letter Grade The final mark will be calculated as a weighted average of the assignments (20%), midterm (30%), and final exam (50%). The letter grade will be determined from the following table: Minimum 80 70 60 50 0 Maximum 100 79 69 59 49 Letter Grade 2. Use the following DataSource class that generates some sample StudentRecord instances: public class DataSource public static ObservableList getAllMarks observableListCStudentRecord> marks = FXCollections.observableArrayList ) // Student ID, Assignments, Midterm, Final exam marks.add (new StudentRecord ("100100100", 75.0f, 68.0f, 54.25f)) marks.add (new StudentRecord ("100100101", 70.Of, 69.25f, 51.5f)) marks.add (new StudentRecord ("100100102", 100.0f, 97.0f, 92.5f)) marks.add (new StudentRecord ("100100103", 90.0f, 88.5f, 68.75f)) marks.add (new StudentRecord("100100104", 72.25f, 74.75f, 58.25f) marks.add (new StudentRecord ("100100105", 85.Of, 56.0f, 62.5f)) marks.add (new StudentRecord ("100100106", 70.0f, 66.5f, 61.75f)); marks.add (new StudentRecord ("100100107", 55.0f, 47.0f, 50.5f)) marks.add (new StudentRecord ("100100108", 40.Of, 32.5f, 27.75f)) marks.add (new StudentRecord ("100100109", 82.5f, 77.0f, 74.25f)) return marks; 3. Create a table that will show a list of StudentRecord objects, using our DataSource data Note: This table user interface can use FXML or you can define it programmatically Note: See figure 1 for an example of the final product Lab 05 Solutions Final Exanm 54.25 51.5 92.5 68.75 SID 100100100 100100101 100100102 100100103 100100104 100100105 100100106 100100107 100100108 100100109 Final Mark 62.525 60.525 95.35 78.925 66.0 65.05 64.825 50.35 31.625 76.725 Assignments 75.0 70.0 100.0 90.0 Midterm Letter Grade 68.0 69.25 97.0 88.5 74.75 56.0 66.5 47.0 32.5 77.0 85.0 70.0 55.0 40.0 82.5 62.5 50.5 27.75 74.25 Figure 1: The running application, showing the marks table