

Answered step by step
Verified Expert Solution
Question
1 Approved Answer
Create a good scientific graph of the data from your class cheese experiment. Graph mass of cheese as the dependent variable (use excel) Whey Group
Create a good scientific graph of the data from your class cheese experiment. Graph mass of cheese as the dependent variable (use excel)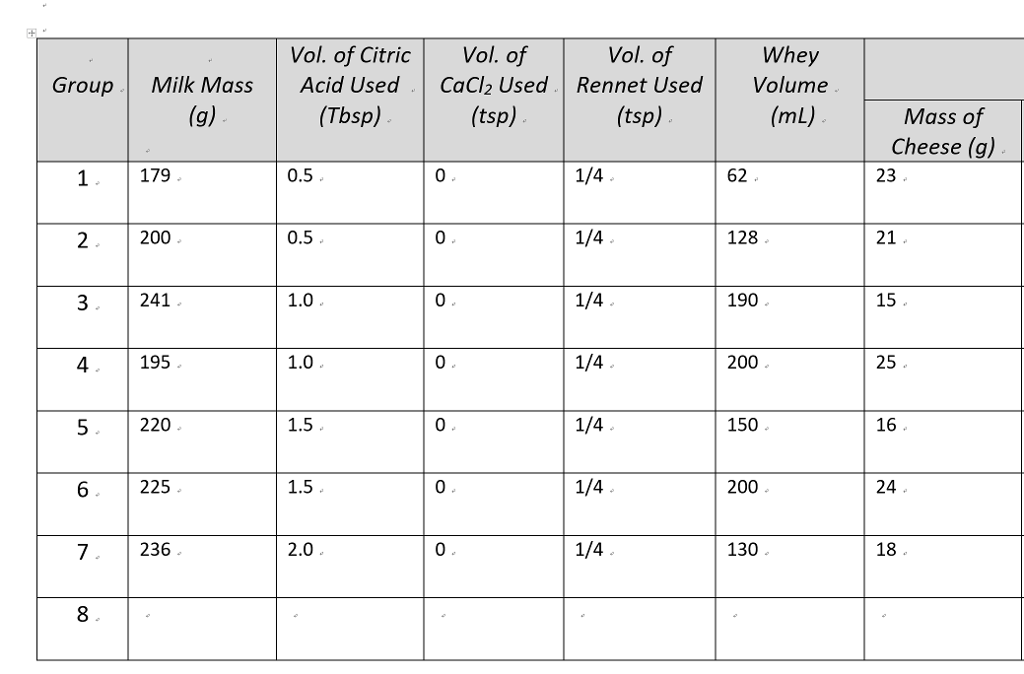
Step by Step Solution
There are 3 Steps involved in it
Step: 1

Get Instant Access to Expert-Tailored Solutions
See step-by-step solutions with expert insights and AI powered tools for academic success
Step: 2

Step: 3
Ace Your Homework with AI
Get the answers you need in no time with our AI-driven, step-by-step assistance
Get Started
Modern Database Management
Authors: Jeff Hoffer, Ramesh Venkataraman, Heikki Topi
13th Edition Global Edition
1292263350, 978-1292263359