

Answered step by step
Verified Expert Solution
Question
1 Approved Answer
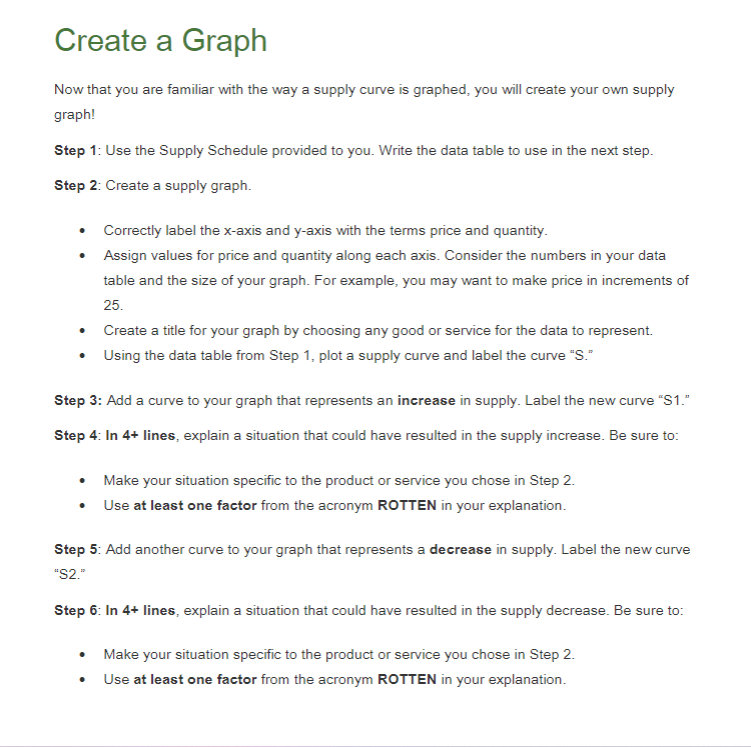
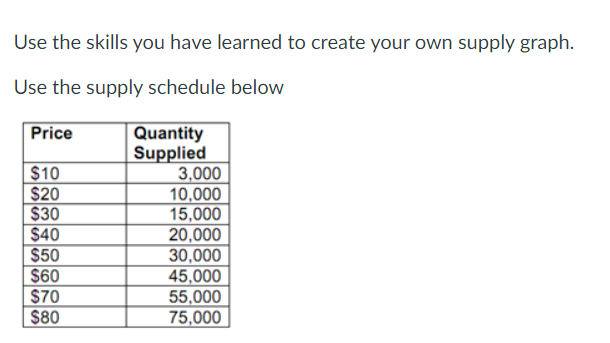
Create a Graph Now that you are familiar with the way a supply curve is graphed, you will create your own supply graph! Step 1:
Step by Step Solution
There are 3 Steps involved in it
Step: 1

Get Instant Access to Expert-Tailored Solutions
See step-by-step solutions with expert insights and AI powered tools for academic success
Step: 2

Step: 3
Ace Your Homework with AI
Get the answers you need in no time with our AI-driven, step-by-step assistance
Get Started
Econometric Analysis
Authors: William H. Greene
5th Edition
130661899, 978-0130661890