

Question
Create a Histogram according to number of occurrence of each character in the input string BY USING READY-TO-USE COMPONENTS OF JavaFX using Scene Builder. The
Create a Histogram according to number of occurrence of each character in the input string BY USING READY-TO-USE COMPONENTS OF JavaFX using Scene Builder.
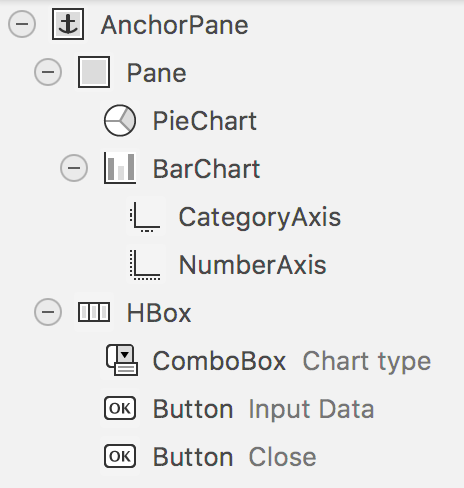
The program should have 1 BarChart, 1 PieChart, 1 ComboBox and 2 buttons in its GUI:
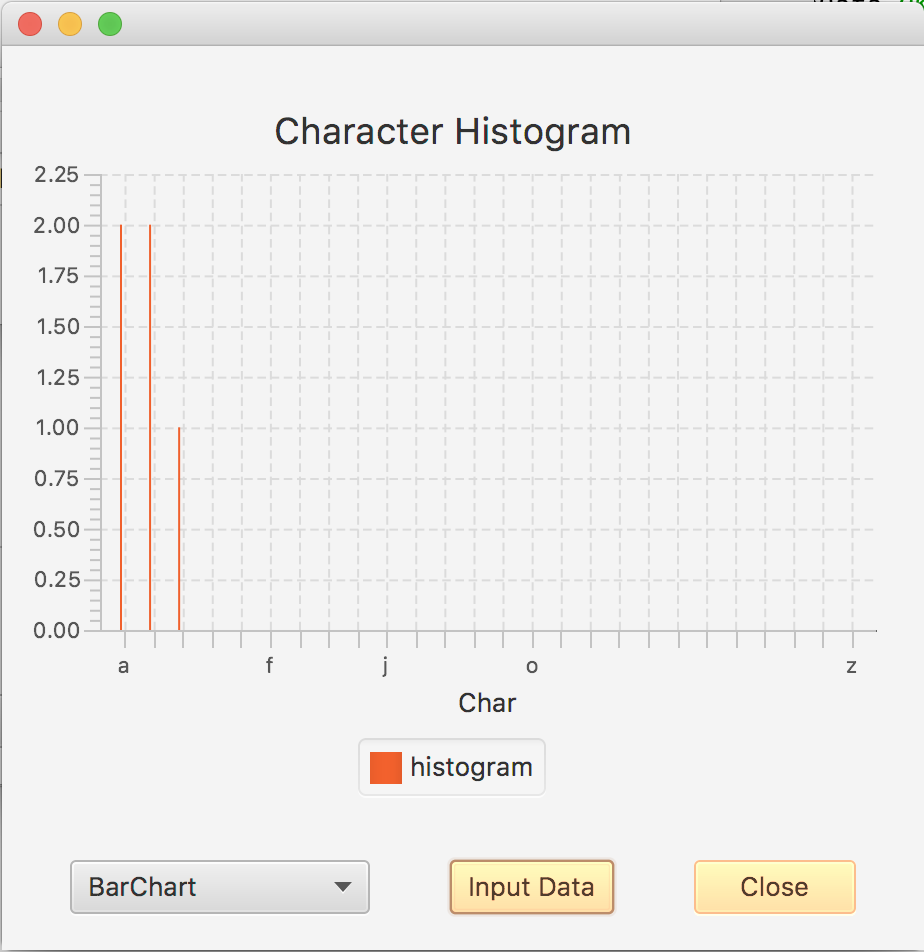
When the GUI is initially launched, BarChart chart type will be displayed in the ComboBox and BarChart will be visible.
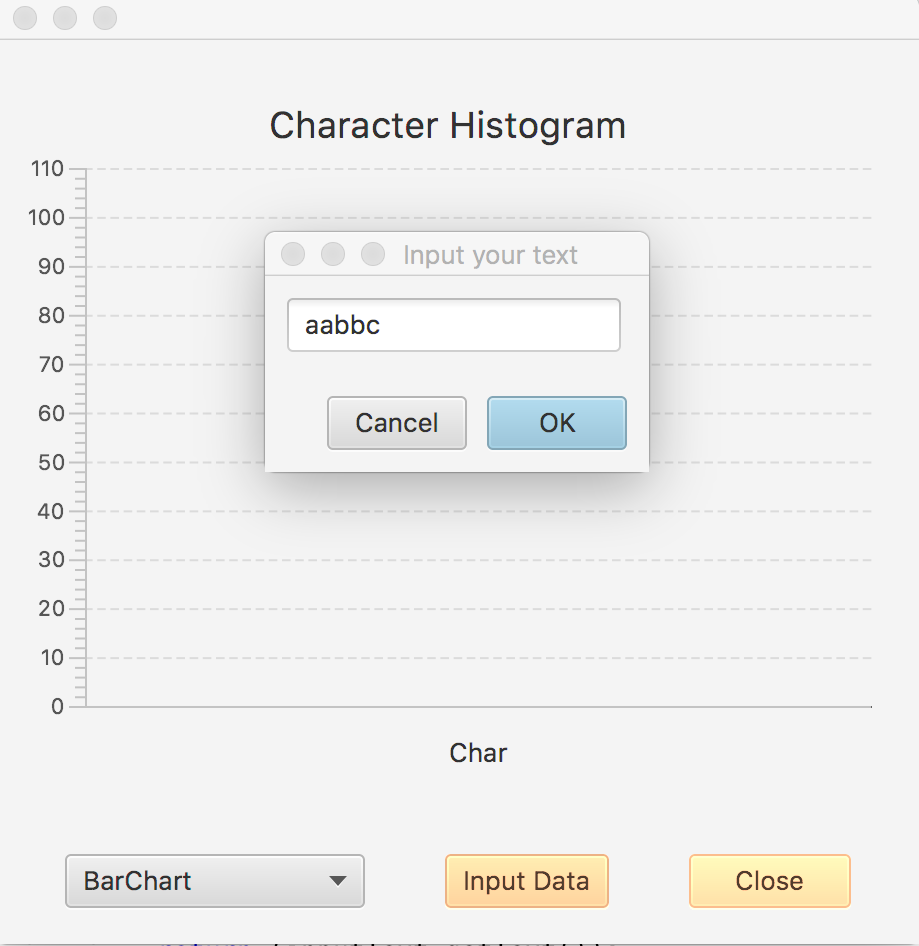
When the Input Data button is pressed, a dialog will be opened, and user will be able to input some text. If Cancel is pressed, the Input Your Text dialog will be closed and the screen wont be refreshed. However, if OK button is pressed, the Input Your Textdialog will be closed and the active chart type will be refreshed.
It is sufficient to add the data to the chart, you are not required to change the colors, or manipulate any other format. Also, the color for the buttons in the figures is completely optional, you do not need to update the color of the buttons in the GUI.
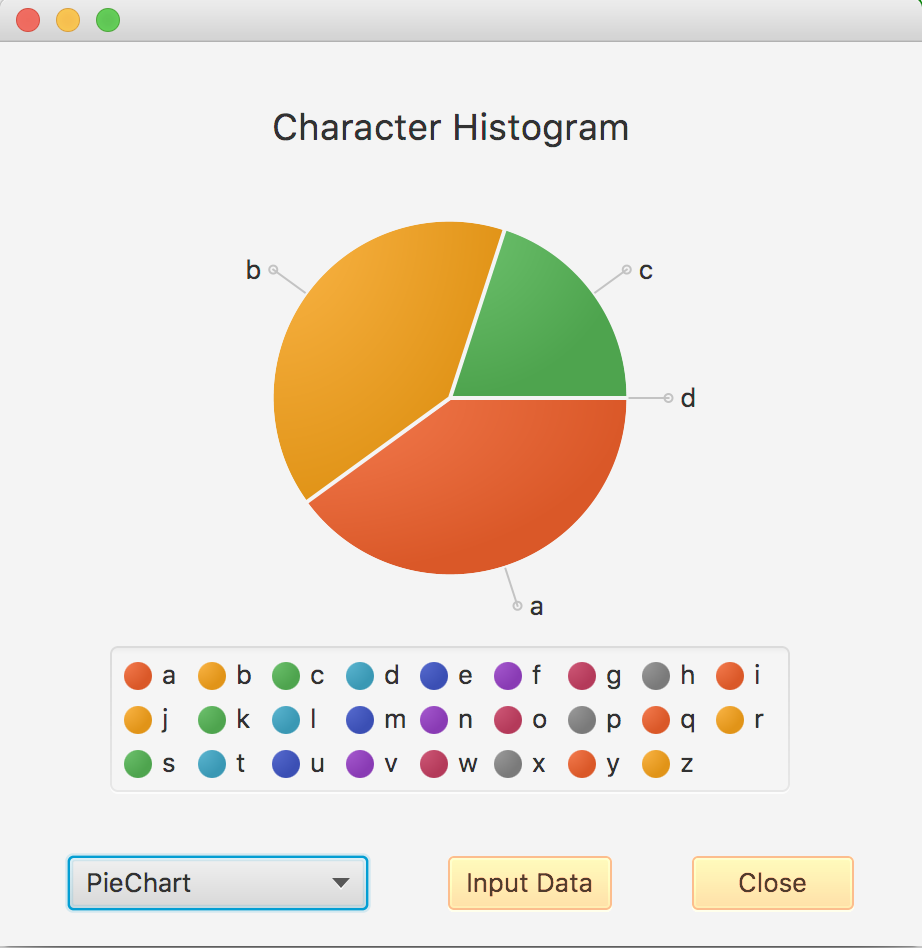
You are going to implement changed function of the ComboBox, and according to the selection, the selected chart will be refreshed.
Here is the FXMLDocumentController.java:
package assignment6;
import java.net.URL;
import java.util.Arrays;
import java.util.Optional;
import java.util.ResourceBundle;
import javafx.application.Platform;
import javafx.beans.value.ChangeListener;
import javafx.beans.value.ObservableValue;
import javafx.event.ActionEvent;
import javafx.fxml.FXML;
import javafx.fxml.Initializable;
import javafx.scene.chart.BarChart;
import javafx.scene.chart.PieChart;
import javafx.scene.chart.XYChart;
import javafx.scene.chart.XYChart.Series;
import javafx.scene.control.Button;
import javafx.scene.control.ButtonBar.ButtonData;
import javafx.scene.control.ButtonType;
import javafx.scene.control.ComboBox;
import javafx.scene.control.Dialog;
import javafx.scene.control.TextField;
import javafx.scene.layout.GridPane;
import javafx.stage.Stage;
enum ChartType{barChart, pieChart};
public class FXMLDocumentController implements Initializable {
final int TOTAL_CHARS = 26;
ChartType mChartType;
int mChars[];
@FXML
private void didClickCloseButton(ActionEvent event){
Stage stage = (Stage) mButtonClose.getScene().getWindow();
stage.close();
}
private String showInputDialog(){
Dialog
dialog.setTitle("Input your text");
ButtonType okButton = new ButtonType("OK", ButtonData.OK_DONE);
dialog.getDialogPane().getButtonTypes().addAll(okButton, ButtonType.CANCEL);
GridPane gridPane = new GridPane();
gridPane.setHgap(10);
gridPane.setVgap(10);
TextField inputText = new TextField();
inputText.setPromptText("Input Text");
gridPane.add(inputText, 0, 0);
dialog.getDialogPane().setContent(gridPane);
Platform.runLater(()->inputText.requestFocus());
dialog.setResultConverter((ButtonType dialogButton) -> {
if (dialogButton == okButton) {
return (inputText.getText());
}
return (null);
});
Optional
return (result.get());
}
private void paint(){
// Please implement this function
// This function according to the mChartType
// refreshes either BarChart or PieChart
// You need to add each item and its occurance (for instance 'a', 2)
// to the selected chart for each character in the alpabet
}
@FXML
private void didClickInputButton(ActionEvent event) {
Arrays.fill(mChars, 0);
String s = showInputDialog();
if ((s!= null) && (s.trim().length() > 0)){
s = s.toLowerCase();
for (int i=0;i Character ch = s.charAt(i); if (Character.isAlphabetic(ch)){ int index = ch - 'a'; mChars[index]++; } } } paint(); } @Override public void initialize(URL url, ResourceBundle rb) { // Please implement this function // 1. initialize your mChars array // 2. make mPieChart hidden // 3. set mChartType to barChart // 4. add "BarChart" and "PieChart" to the comboBox // 5. set selected item "BarChart" in the combobox // 6. add ChangeListener to ComboBox, and implement changed event // 7. In the changed event update the mChartType according to newValue and // 8. update the visibility of the charts accordingly // 9. call the paint } }
Step by Step Solution
There are 3 Steps involved in it
Step: 1

Get Instant Access to Expert-Tailored Solutions
See step-by-step solutions with expert insights and AI powered tools for academic success
Step: 2

Step: 3
Ace Your Homework with AI
Get the answers you need in no time with our AI-driven, step-by-step assistance
Get Started
Professional SQL Server 2000 Database Design
Authors: Louis Davidson
1st Edition
1861004761, 978-1861004765