

Question
Create a histogram for the variables fage, mage, weeks, gained, and tpounds. Describe the shape of the distribution, Is the mean or the median a
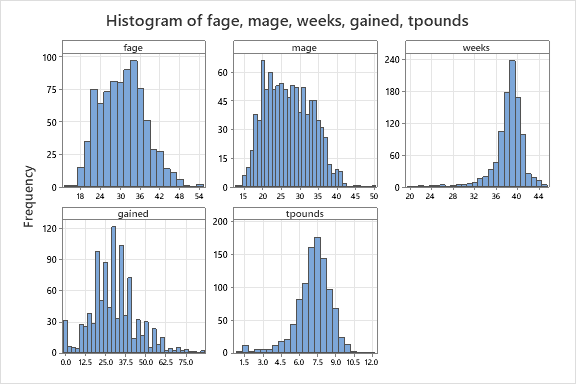
Create a histogram for the variables fage, mage, weeks, gained, and tpounds. Describe the shape of the distribution, Is the mean or the median a better measure of the center for each of the variables?
Step by Step Solution
There are 3 Steps involved in it
Step: 1

Get Instant Access to Expert-Tailored Solutions
See step-by-step solutions with expert insights and AI powered tools for academic success
Step: 2

Step: 3
Ace Your Homework with AI
Get the answers you need in no time with our AI-driven, step-by-step assistance
Get Started
Finite Mathematics
Authors: Stefan Waner, Jerry Lee Ford Jr, Waner/Costenoble, Steven Costenoble
5th Edition
1111789304, 9781111789305