

Question
Create a Matlab Monte Carlo simulation for 4-QAM (QPSK) (Monte Carlo simply means repeated trials of a probabilistic experiment). Make this a baseband simulation, using
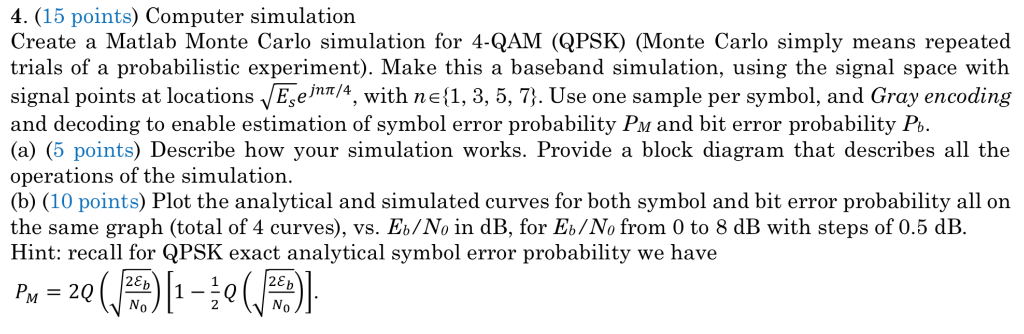 Create a Matlab Monte Carlo simulation for 4-QAM (QPSK) (Monte Carlo simply means repeated trials of a probabilistic experiment). Make this a baseband simulation, using the signal space with signal points at locations /4, with n{1, 3, 5, 7}. Use one sample per symbol, and Gray encoding and decoding to enable estimation of symbol error probability PM and bit error probability Pb. (a) (5 points) Describe how your simulation works. Provide a block diagram that describes all the operations of the simulation. (b) (10 points) Plot the analytical and simulated curves for both symbol and bit error probability all on the same graph (total of 4 curves), vs. Eb/N0 in dB, for Eb/N0 from 0 to 8 dB with steps of 0.5 dB. Hint: recall for QPSK exact analytical symbol error probability we have =2(2E)[11(2E)]. 0 2 0
Step by Step Solution
There are 3 Steps involved in it
Step: 1

Get Instant Access to Expert-Tailored Solutions
See step-by-step solutions with expert insights and AI powered tools for academic success
Step: 2

Step: 3
Ace Your Homework with AI
Get the answers you need in no time with our AI-driven, step-by-step assistance
Get Started
Lncs 5069 Scientific And Statistical Database Management 20th International Conference Ssdbm 2008 Hong Kong China July 9 11 2008 Proceedings
Authors: Bertram Ludascher ,Nikos Mamoulis
2008th Edition
3540694765, 978-3540694762