

Answered step by step
Verified Expert Solution
Question
1 Approved Answer
Create a PivotTable to Create a PivotTable to Create a PivotTable to 1 . 5 Create a PivotTable to Create a PivotTable that Create a
Create a PivotTable to
Create a PivotTable to
Create a PivotTable to
Create a PivotTable to
Create a PivotTable that
Create a PivotTable to
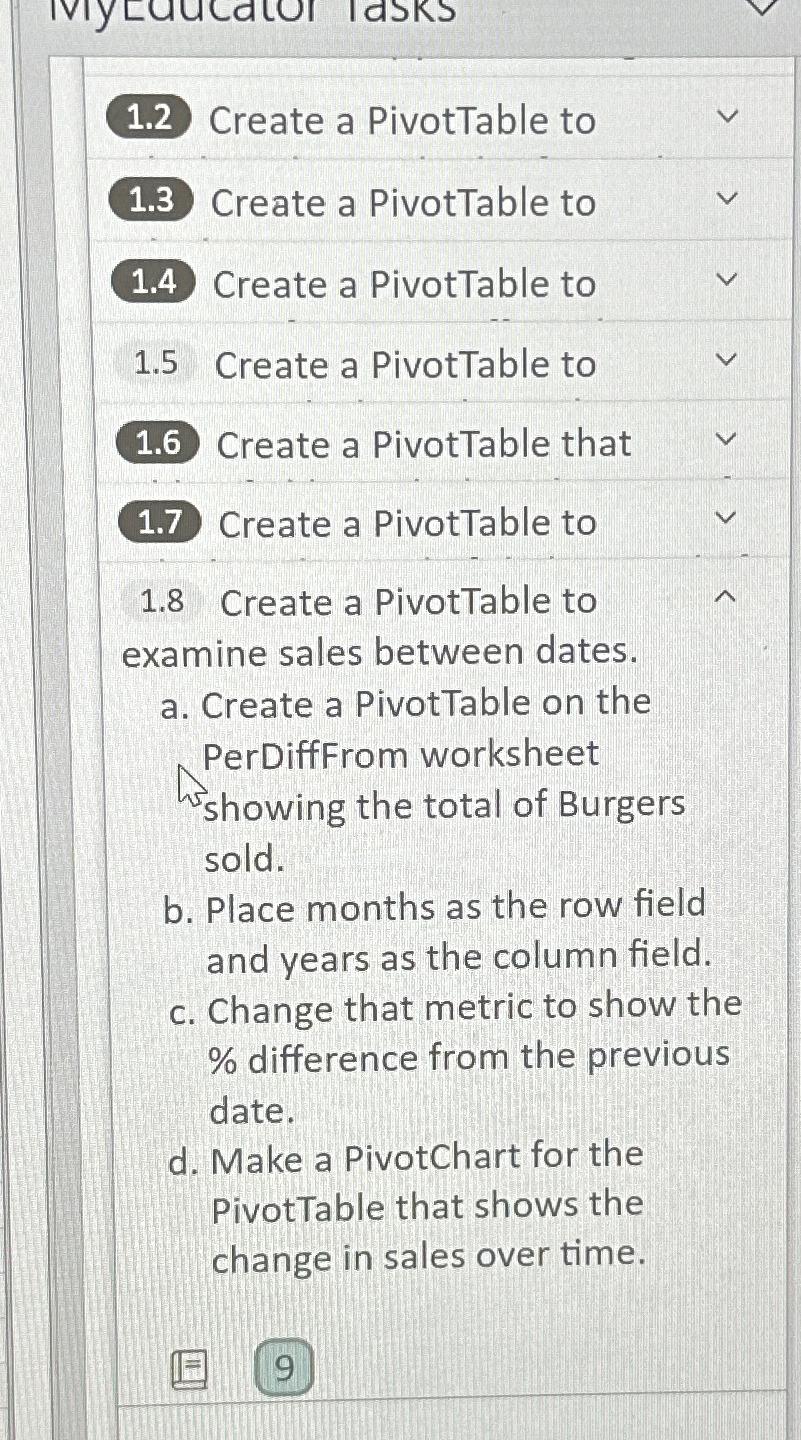
Create a PivotTable to examine sales between dates.
a Create a PivotTable on the PerDiffFrom worksheet showing the total of Burgers sold.
b Place months as the row field and years as the column field.
c Change that metric to show the difference from the previous date.
d Make a PivotChart for the PivotTable that shows the change in sales over time.
Step by Step Solution
There are 3 Steps involved in it
Step: 1

Get Instant Access to Expert-Tailored Solutions
See step-by-step solutions with expert insights and AI powered tools for academic success
Step: 2

Step: 3
Ace Your Homework with AI
Get the answers you need in no time with our AI-driven, step-by-step assistance
Get Started
Database Processing
Authors: David Kroenke
11th Edition
0132302675, 9780132302678