

Answered step by step
Verified Expert Solution
Question
1 Approved Answer
Create a Python code to execute the following steps: Step (1): Import the pandas, numpy, and seaborn libraries. import pandas as pd import numpy as
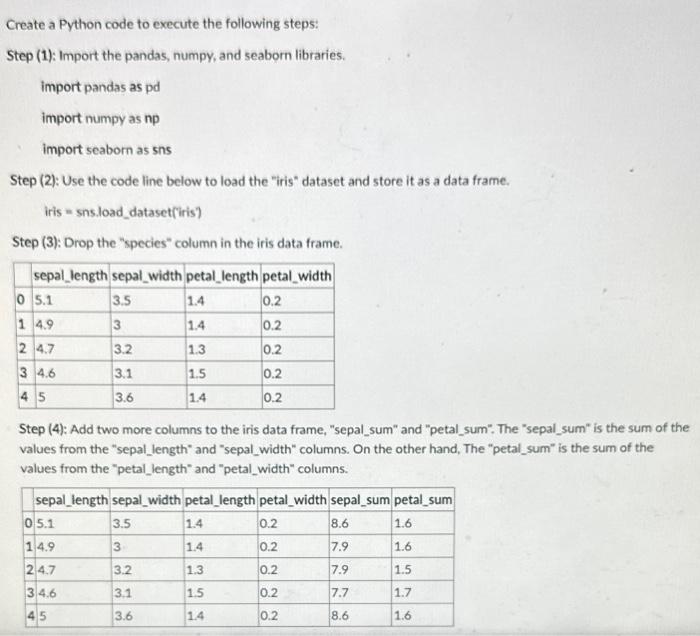
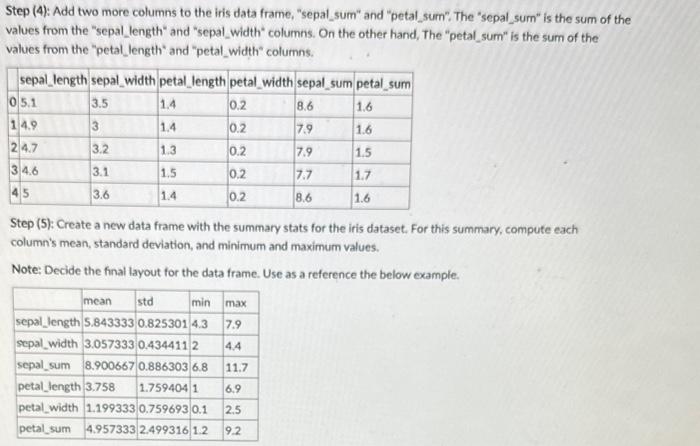
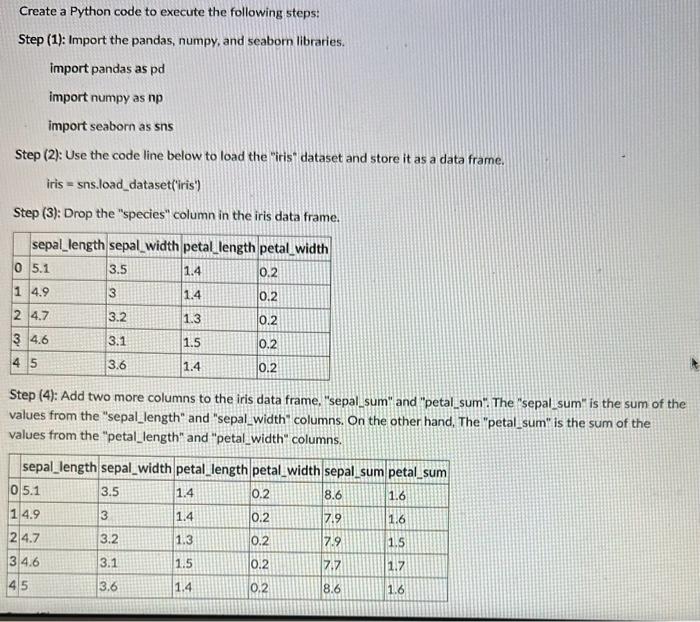
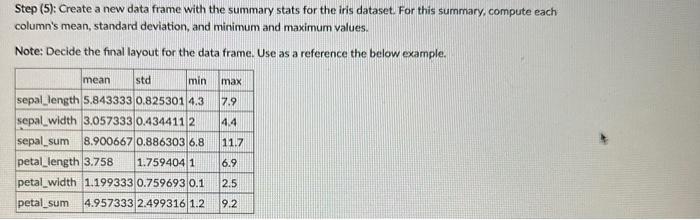 Create a Python code to execute the following steps: Step (1): Import the pandas, numpy, and seaborn libraries. import pandas as pd import numpy as np import seaborn as sns Step (2): Use the code line below to load the "iris" dataset and store it as a data frame. iris = sns.load_dataset(iris) Step (3): Drop the "species" column in the iris data frame. Step (4): Add two more columns to the iris data frame, "sepal_sum" and "petal_sum". The "sepal_sum" is the sum of the values from the "sepal_length" and "sepal_width" columns. On the other hand, The "petal_sum" is the sum of the values from the "petal_length" and "petal_width" columns. Step (4): Add two more columns to the iris data frame, "sepal_sum" and "petal_sum". The "sepal_sum" is the sum of the values from the "sepal_length" and "sepal_width" columns. On the other hand, The "petal_sum" is the sum of the values from the "petal_length" and "petal_width" columns. Step (5): Create a new data frame with the summary stats for the iris dataset. For this summary, compute each column's mean, standard deviation, and minimum and maximum values. Note: Decide the final layout for the data frame. Use as a reference the below example. Create a Python code to execute the following steps: Step (1): Import the pandas, numpy, and seabom libraries. import pandas as pd import numpy as np import seaborn as sns Step (2): Use the code line below to load the "iris" dataset and store it as a data frame. iris = sns.load_dataset('iris') Step (3): Drop the "species" column in the iris data frame. Step (4): Add two more columns to the iris data frame, "sepal sum" and "petal sum". The "sepal sum" is the sum of the values from the "sepal_length" and "sepal_width" columns. On the other hand, The "petal_sum" is the sum of the values from the "petal_length" and "petal_width" columns. Step (5): Create a new data frame with the summary stats for the iris dataset. For this summary, compute each column's mean, standard deviation, and minimum and maximum values. Note: Decide the final layout for the data frame. Use as a reference the below example
Step by Step Solution
There are 3 Steps involved in it
Step: 1

Get Instant Access to Expert-Tailored Solutions
See step-by-step solutions with expert insights and AI powered tools for academic success
Step: 2

Step: 3
Ace Your Homework with AI
Get the answers you need in no time with our AI-driven, step-by-step assistance
Get Started
Databases Illuminated
Authors: Catherine M Ricardo, Susan D Urban
3rd Edition
1284056945, 9781284056945