Answered step by step
Verified Expert Solution
Question
1 Approved Answer
create a residual plot of residuals vs height(in inches) for your 30 data values. Does the residual plot reveal a pattern, suggesting a linear model
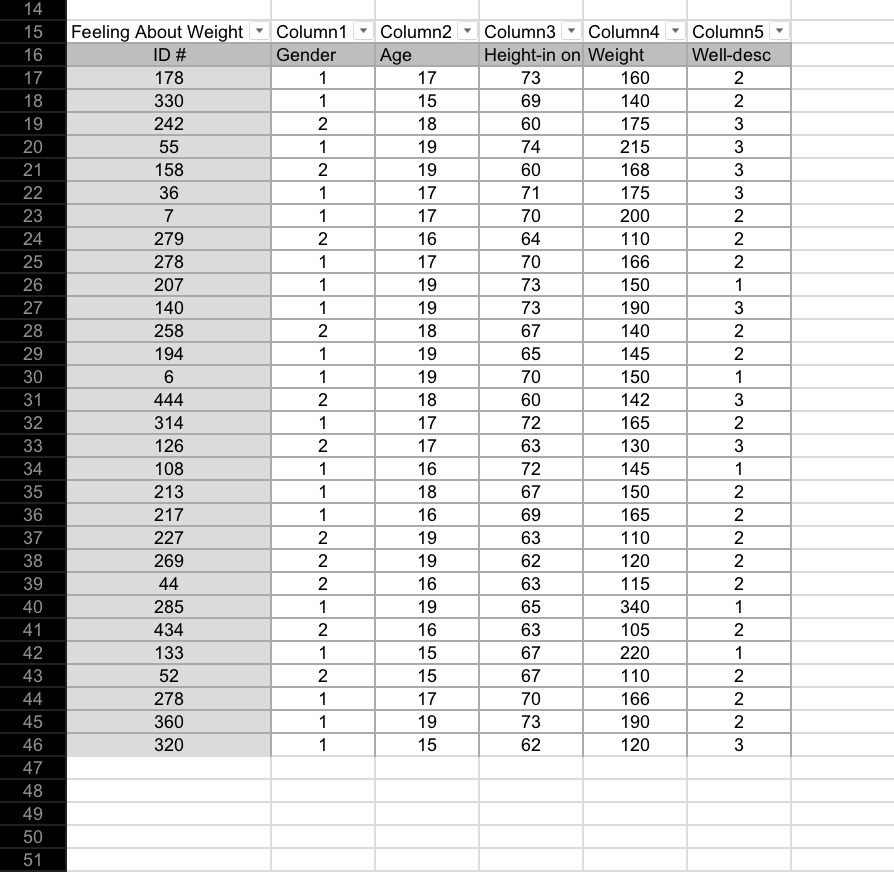
create a residual plot of residuals vs height(in inches) for your 30 data values. Does the residual plot reveal a pattern, suggesting a linear model is not appropriate? If not appropriate, take a transformation weight vs log(height) or sqr-root(weight) vs height then reexamine your relationship by examining the revised scatterplot and residual plot. Does the association appear to be fairly linear now? explain.
The photo has the 30 data value sets

Step by Step Solution
There are 3 Steps involved in it
Step: 1

Get Instant Access to Expert-Tailored Solutions
See step-by-step solutions with expert insights and AI powered tools for academic success
Step: 2

Step: 3

Ace Your Homework with AI
Get the answers you need in no time with our AI-driven, step-by-step assistance
Get Started


