Create Consolidated Financial Statements for Company Letter L for year 17&18
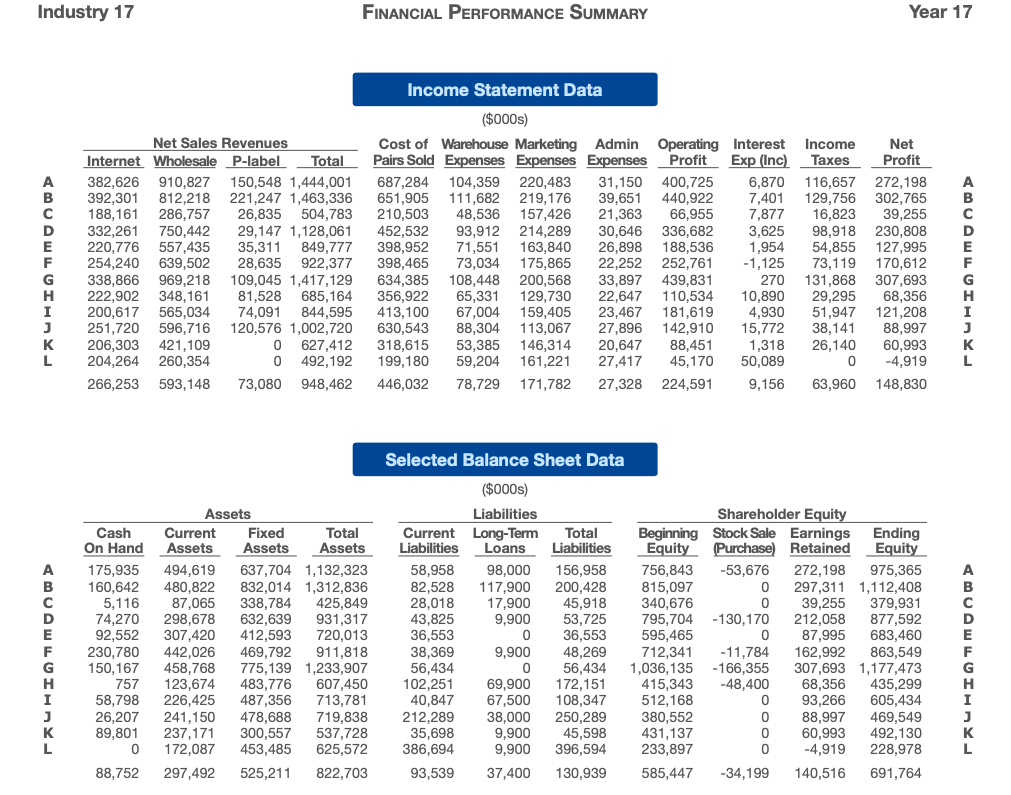
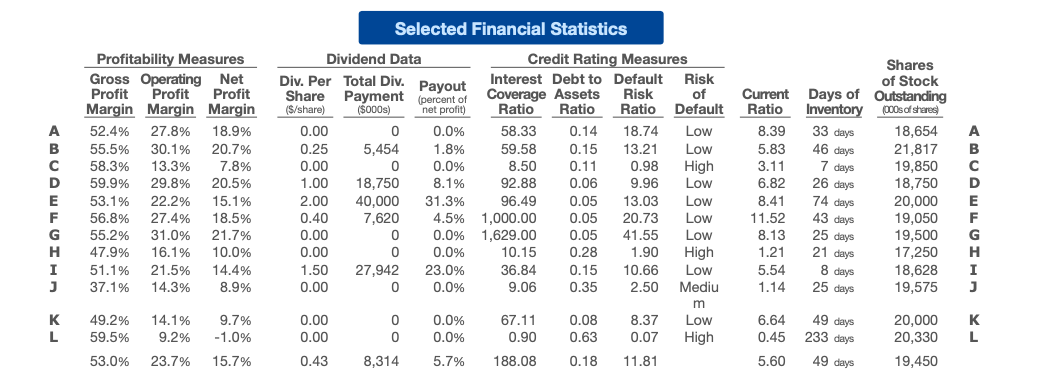
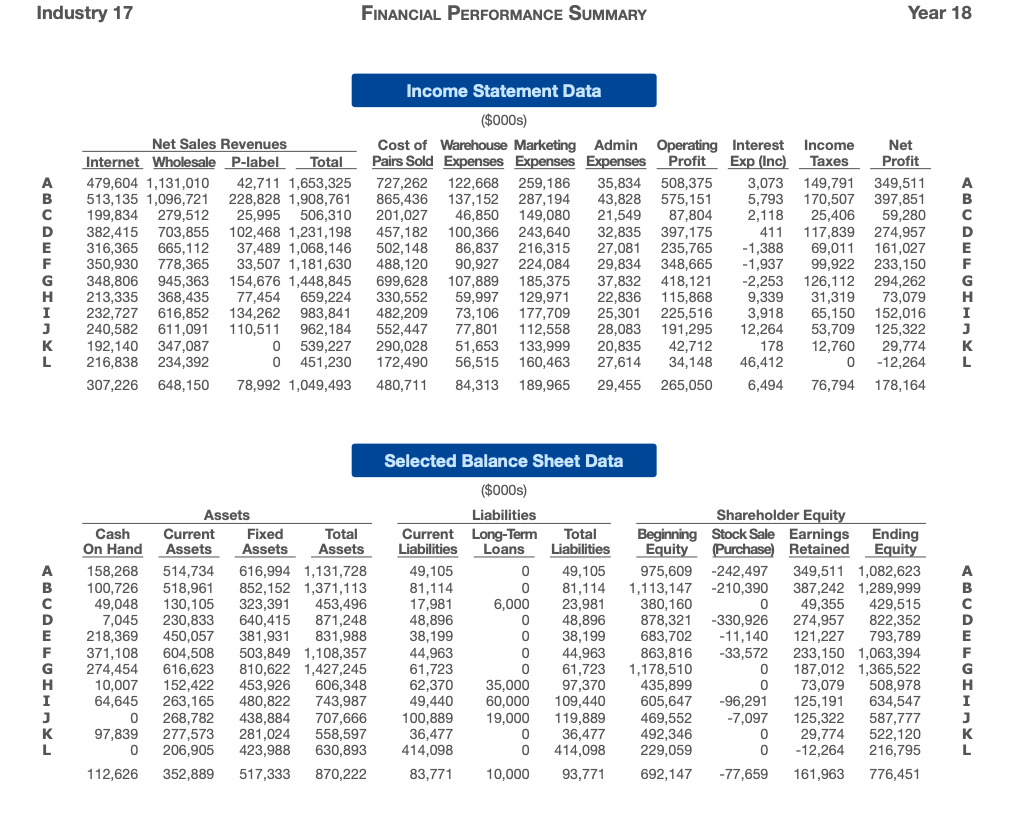
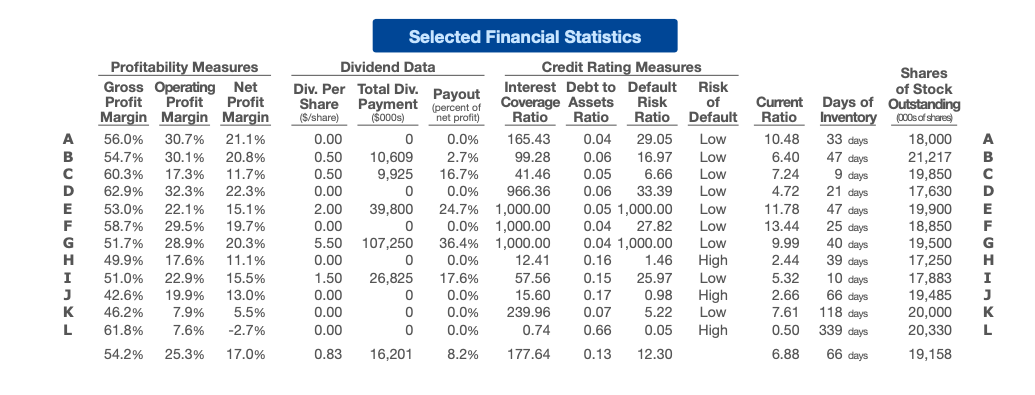
Industry 17 FINANCIAL PERFORMANCE SUMMARY Year 17 Income Statement Data A 332,261 750,442 29,147 1, 452,532 336,682 3,625 163,840 ($000s) Cost of Warehouse Marketing Admin Pairs Sold Expenses Expenses Expenses 687,284 104,359 220,483 31,150 651,905 111,682 219,176 39,651 210,503 48,536 157,426 21,363 93,912 214,289 30,646 398,952 71,551 26,898 398,465 0.004 73,034 175,865 22,252 634,385 108,448 200,568 33,897 356,922 65,331 129,730 22,647 413,100 67,004 159,405 23,467 630,543 88,304 113,067 27,896 318,615 53,385 146,314 20,647 199,180 59,204 161,221 27,417 446,032 78,729 171,782 27,328 188,536 54,855 Net Sales Revenues Internet Wholesale P-label Total 382,626 910,827 150,548 1,444,001 392,301 812,218 221,247 1,463,336 188,161 286,757 26,835 504.783 1,128,061 220,776 20: 557,435 35,311 849,777 254,240 639,502 922,377 338,866 969,218 109,045 1,417,129 222,902 348,161 81,528 685,164 200,617 565,034 74,091 844,595 251,720 596,716 120,576 1,002,720 206,303 421,109 0 627,412 204,264 260,354 0 492,192 266,253 593,148 73,080 948,462 127,995 170,612 28,635 Operating Interest Income Net Profit Exp (Inc) Taxes Profit 400.725 6,870 116,657 272,198 440,922 7,401 129,756 302,765 66,955 7,877 16,823 39,255 98,918 230,808 1,954 73,119 439,831 270 131,868 307,693 110,534 10,890 29,295 68,356 181,619 4,930 51,947 121,208 142,910 15,772 38,141 88,997 88,451 1,318 60,993 50,089 0 224,591 9,156 63,960 148,830 TOITMO 252,761 -1,125 AUHIMU J K L 26,140 45,170 -4,919 Selected Balance Sheet Data B A B 39,255 -130,170 307,420 720,013 Assets Current Fixed Total Assets Assets Assets 494,619 637,704 1,132,323 480,822 832,014 1,312,836 87,065 338,784 425,849 298,678 632,639 931,317 412,593 412:09 442,026 469,792 911,818 458,768 775,139 1,233,907 123,674 483,776 607,450 226,425 487,356 713,781 241,150 478,688 719,838 237,171 300,557 537,728 172,087 453,485 625,572 297,492 525,211 822,703 KUHITIMO Cash On Hand 175,935 160,642 5,116 74,270 92,552 230,780 150,167 757 58,798 26,207 89,801 0 88,752 F ($000s) Liabilities Current Long-Term Liabilities Loans 58,958 98,000 82,528 117,900 28,018 17,900 43,825 9,900 36,553 30.05. 38,369 9,900 102,251 69,900 40,847 67,500 212,289 38,000 35,698 9,900 386,694 9,900 93,539 37,400 Total Liabilities 156,958 200,428 45,918 53,725 36,553 48,269 56,434 172,151 108,347 250,289 45,598 396,594 130,939 Shareholder Equity Beginning Stock Sale Earnings Ending Equity Purchase) Retained Equity 756,843 -53,676 272,198 975,365 815,097 0 297,311 1,112,408 340,676 0 379,931 795,704 212,058 877,592 595,465 87.995 683,460 01:30 000.00 712,341 -11,784 162,992 863,549 1,036,135 -166,355 307,693 1,177,473 415,343 -48,400 68,356 435,299 512,168 0 93,266 605,434 380,552 0 88,997 469,549 431,137 0 60,993 492,130 233,897 0 -4,919 228,978 585,447 -34,199 140,516 691,764 56,434 KUHIMU L L Selected Financial Statistics net profit) A A B D E F G H I J Profitability Measures Gross Operating Net Profit Profit Profit Margin Margin Margin 52.4% 27.8% 18.9% 55.5% 30.1% 20.7% 58.3% 13.3% 7.8% 59.9% 29.8% 20.5% 53.1% 22.2% 15.1% 56.8% 27.4% 18.5% 55.2% 31.0% 21.7% 47.9% 16.1% 10.0% 51.1% 21.5% 14.4% 37.1% 14.3% 8.9% 7 days 26 days 74 days Imo Dividend Data Credit Rating Measures Div. Per Total Div. Payout Interest Debt to Default Risk Share Payment percent of Coverage Assets Risk of (S/share) (5000s) Ratio Ratio Ratio Default 0.00 0 0.0% 58.33 0.14 18.74 Low 0.25 5,454 1.8% 59.58 0.15 13.21 Low 0.00 0 0.0% 8.50 0.11 0.98 High 1.00 18,750 8.1% 92.88 0.06 9.96 Low 2.00 40,000 31.3% 96.49 0.05 13.03 Low 0.40 7,620 4.5% 1,000.00 0.05 20.73 Low 0.00 0 0.0% 1,629.00 0.05 41.55 Low 0.00 0 0.0% 10.15 0.28 1.90 High 1.50 27,942 23.0% 36.84 0.15 10.66 Low 0.00 0 0 0.0% 0.35 2.50 Mediu m 0.00 0 0.0% 67.11 0.08 8.37 Low 0.00 0 0.0% 0.90 0.63 0.07 High 0.43 8,314 5.7% 188.08 0.18 11.81 Shares of Stock Current Days of Outstanding Ratio Inventory000s of shares 8.39 33 days 18,654 5.83 46 days 21,817 3.11 19,850 6.82 18,750 8.41 20,000 11.52 43 days 19,050 8.13 25 days 19,500 1.21 21 days 17,250 5.54 18,628 1.14 19,575 UITO A B D E F G H 9.06 8 days 25 days K L 49 days 49.2% 59.5% 14.1% 9.2% 9.7% -1.0% 6.64 0.45 20,000 20,330 19,450 K L 233 days 53.0% 23.7% 15.7% 5.60 49 days Industry 17 FINANCIAL PERFORMANCE SUMMARY Year 18 3,073 A B B D E Income Statement Data ($000s) Cost of Warehouse Marketing Admin Pairs Sold Expenses Expenses Expenses 727,262 122,668 259,186 35,834 865,436 137,152 287,194 43.828 201,027 46,850 149,080 21,549 457,182 243,640 32,835 502,148 86,837 216,315 27,081 488,120 90,921 224,084 29,834 699,628 107,889 185,375 37,832 330,552 59,997 129,971 22,836 482,209 73,106 177,709 25,301 552,447 77,801 112,558 28,083 290,028 51,653 133,999 172,490 160,463 480,711 84,313 189,965 29,455 Net Sales Revenues Internet Wholesale P-label Total 479,604 1,131,010 42,711 1,653,325 513,135 1,096,721 228,828 1,908,761 199,834 279,512 25,995 506,310 382,415 703,855 102,468 1,231,198 316,365 665,112 37,489 1,068,146 778,365 33,507 1,181,630 348,806 945,363 154,676 1,448,845 213,335 368,435 77,454 659,224 232,727 616,852 134,262 983,841 240,582 611,091 110,511 962,184 192,140 347,087 0 539,227 216.838 234,392 0 451,230 307,226 648,150 78,992 1,049,493 100,366 350,930 Operating Interest Profit Exp (Inc) 508,375 575,151 5,793 87,804 2,118 397,175 411 235,765 -1,388 -1,937 418,121 -2,253 115,868 9,339 225,516 3,918 191,295 12,264 42,712 178 34,148 46,412 265,050 6,494 348,665 Income Net Taxes Profit 149,791 349,511 170,507 397,851 25,406 59,280 117,839 274,957 69,011 161,027 233,150 126,112 294,262 31,319 73,079 65,150 152,016 53,709 125,322 12,760 29,774 0 76,794 178,164 99,922 G H I J L GHIOTTO J L 20,835 27,614 56,515 -12,264 Selected Balance Sheet Data Cash Assets Current Fixed Total Assets Assets Assets 514,734 616,994 1,131,728 518,961 852,152 1,371,113 130,105 323,391 453,496 230,833 640,415 871,248 450,057 381,931 831,988 503,849 1,108,357 616,623 810,622 1,427,245 152,422 453,926 606,348 263,165 480,822 743,987 438,884 707,666 277,573 281,024 558,597 206,905 423,988 630,893 352,889 517,333 870,222 On Hand 158,268 100,726 49,048 7,045 218,369 371,108 274,454 64,645 0 97,839 0 ($000s) Liabilities Current Long-Term Liabilities Loans 49, 105 0 81,114 0 17,981 6,000 48,896 0 38.199 38,199 0 44 963 n 44,963 61,723 62,370 35,000 49,440 60,000 19,000 36,477 0 414,098 0 83,771 10,000 Total Liabilities 49,105 81,114 23,981 48,896 38,199 683,702 121,227 AUHITIMO 604,508 Shareholder Equity Beginning Stock Sale Earnings Ending Equity (Purchase) Retained Equity 975,609 -242,497 349,511 1,082,623 1,113,147 -210,390 387,242 1,289,999 380,160 0 49,355 429,515 878,321 -330,926 274,957 822,352 -11,140 793,789 863,816 -33,572 233,150 1,063,394 1,178,510 187,012 1,365,522 435,899 73,079 508,978 605,647 -96,291 125,191 634,547 -7,097 125,322 587,777 492,346 29,774 522,120 229,059 0 -12,264 216,795 692,147 -77,659 161,963 776,451 44,963 61,723 10,007 G FAHITIMO 268,782 97,370 109,440 119,889 36,477 414,098 93,771 100,889 469,552 112,626 Selected Financial Statistics B D B D E F G UWUIHY Profitability Measures Gross Operating Net Profit Profit Profit Margin Margin Margin 56.0% 30.7% 21.1% 54.7% 30.1% 20.8% 60.3% 17.3% 11.7% 62.9% 32.3% 22.3% 53.0% 22.1% 15.1% 58.7% 29.5% 19.7% 51.7% 28.9% 20.3% 49.9% 17.6% 11.1% 51.0% 22.9% 15.5% 42.6% 19.9% 13.0% 46.2% 7.9% 5.5% 61.8% 7.6% -2.7% 54.2% 25.3% 17.0% Dividend Data Credit Rating Measures Shares Div. Per Total Div. Payout Interest Debt to Default Risk of Stock Share Payment (percent of Coverage Assets Risk of Current Days of Outstanding ($/share) ( ($000s) net profit) Ratio Ratio Ratio Default Ratio Inventory D00s of shares) 0.00 0 0.0% 165.43 0.04 29.05 Low 10.48 33 days 18,000 0.50 10,609 2.7% 99.28 0.06 16.97 Low 6.40 47 days 21,217 0.50 9,925 16.7% 41.46 0.05 6.66 Low 7.24 9 days 19,850 0.00 0 0.0% 966.36 0.06 33.39 Low 4.72 21 days 17,630 2.00 39,800 24.7% 1,000.00 0.05 1,000.00 Low 11.78 47 days 19,900 0.00 0 0.0% 1,000.00 0.04 27.82 Low 13.44 25 days 18,850 5.50 107,250 36.4% 1,000.00 0.04 1,000.00 Low 9.99 40 days 19,500 0.00 0 0.0% 12.41 0.16 1.46 High 2.44 39 days 17,250 1.50 26,825 17.6% 57.56 0.15 25.97 Low 5.32 10 days 17,883 0.00 0 0 0.0% 15.60 0.17 0.98 High 2.66 66 days 19,485 0.00 0 0.0% 239.96 0.07 5.22 Low 7.61 118 days 20,000 0.00 0 0 0.0% 0.74 0.66 0.05 High 0.50 339 days 20,330 0.83 16,201 8.2% 177.64 0.13 12.30 6.88 66 days 19,158 F TUITO H J L J K L Industry 17 FINANCIAL PERFORMANCE SUMMARY Year 17 Income Statement Data A 332,261 750,442 29,147 1, 452,532 336,682 3,625 163,840 ($000s) Cost of Warehouse Marketing Admin Pairs Sold Expenses Expenses Expenses 687,284 104,359 220,483 31,150 651,905 111,682 219,176 39,651 210,503 48,536 157,426 21,363 93,912 214,289 30,646 398,952 71,551 26,898 398,465 0.004 73,034 175,865 22,252 634,385 108,448 200,568 33,897 356,922 65,331 129,730 22,647 413,100 67,004 159,405 23,467 630,543 88,304 113,067 27,896 318,615 53,385 146,314 20,647 199,180 59,204 161,221 27,417 446,032 78,729 171,782 27,328 188,536 54,855 Net Sales Revenues Internet Wholesale P-label Total 382,626 910,827 150,548 1,444,001 392,301 812,218 221,247 1,463,336 188,161 286,757 26,835 504.783 1,128,061 220,776 20: 557,435 35,311 849,777 254,240 639,502 922,377 338,866 969,218 109,045 1,417,129 222,902 348,161 81,528 685,164 200,617 565,034 74,091 844,595 251,720 596,716 120,576 1,002,720 206,303 421,109 0 627,412 204,264 260,354 0 492,192 266,253 593,148 73,080 948,462 127,995 170,612 28,635 Operating Interest Income Net Profit Exp (Inc) Taxes Profit 400.725 6,870 116,657 272,198 440,922 7,401 129,756 302,765 66,955 7,877 16,823 39,255 98,918 230,808 1,954 73,119 439,831 270 131,868 307,693 110,534 10,890 29,295 68,356 181,619 4,930 51,947 121,208 142,910 15,772 38,141 88,997 88,451 1,318 60,993 50,089 0 224,591 9,156 63,960 148,830 TOITMO 252,761 -1,125 AUHIMU J K L 26,140 45,170 -4,919 Selected Balance Sheet Data B A B 39,255 -130,170 307,420 720,013 Assets Current Fixed Total Assets Assets Assets 494,619 637,704 1,132,323 480,822 832,014 1,312,836 87,065 338,784 425,849 298,678 632,639 931,317 412,593 412:09 442,026 469,792 911,818 458,768 775,139 1,233,907 123,674 483,776 607,450 226,425 487,356 713,781 241,150 478,688 719,838 237,171 300,557 537,728 172,087 453,485 625,572 297,492 525,211 822,703 KUHITIMO Cash On Hand 175,935 160,642 5,116 74,270 92,552 230,780 150,167 757 58,798 26,207 89,801 0 88,752 F ($000s) Liabilities Current Long-Term Liabilities Loans 58,958 98,000 82,528 117,900 28,018 17,900 43,825 9,900 36,553 30.05. 38,369 9,900 102,251 69,900 40,847 67,500 212,289 38,000 35,698 9,900 386,694 9,900 93,539 37,400 Total Liabilities 156,958 200,428 45,918 53,725 36,553 48,269 56,434 172,151 108,347 250,289 45,598 396,594 130,939 Shareholder Equity Beginning Stock Sale Earnings Ending Equity Purchase) Retained Equity 756,843 -53,676 272,198 975,365 815,097 0 297,311 1,112,408 340,676 0 379,931 795,704 212,058 877,592 595,465 87.995 683,460 01:30 000.00 712,341 -11,784 162,992 863,549 1,036,135 -166,355 307,693 1,177,473 415,343 -48,400 68,356 435,299 512,168 0 93,266 605,434 380,552 0 88,997 469,549 431,137 0 60,993 492,130 233,897 0 -4,919 228,978 585,447 -34,199 140,516 691,764 56,434 KUHIMU L L Selected Financial Statistics net profit) A A B D E F G H I J Profitability Measures Gross Operating Net Profit Profit Profit Margin Margin Margin 52.4% 27.8% 18.9% 55.5% 30.1% 20.7% 58.3% 13.3% 7.8% 59.9% 29.8% 20.5% 53.1% 22.2% 15.1% 56.8% 27.4% 18.5% 55.2% 31.0% 21.7% 47.9% 16.1% 10.0% 51.1% 21.5% 14.4% 37.1% 14.3% 8.9% 7 days 26 days 74 days Imo Dividend Data Credit Rating Measures Div. Per Total Div. Payout Interest Debt to Default Risk Share Payment percent of Coverage Assets Risk of (S/share) (5000s) Ratio Ratio Ratio Default 0.00 0 0.0% 58.33 0.14 18.74 Low 0.25 5,454 1.8% 59.58 0.15 13.21 Low 0.00 0 0.0% 8.50 0.11 0.98 High 1.00 18,750 8.1% 92.88 0.06 9.96 Low 2.00 40,000 31.3% 96.49 0.05 13.03 Low 0.40 7,620 4.5% 1,000.00 0.05 20.73 Low 0.00 0 0.0% 1,629.00 0.05 41.55 Low 0.00 0 0.0% 10.15 0.28 1.90 High 1.50 27,942 23.0% 36.84 0.15 10.66 Low 0.00 0 0 0.0% 0.35 2.50 Mediu m 0.00 0 0.0% 67.11 0.08 8.37 Low 0.00 0 0.0% 0.90 0.63 0.07 High 0.43 8,314 5.7% 188.08 0.18 11.81 Shares of Stock Current Days of Outstanding Ratio Inventory000s of shares 8.39 33 days 18,654 5.83 46 days 21,817 3.11 19,850 6.82 18,750 8.41 20,000 11.52 43 days 19,050 8.13 25 days 19,500 1.21 21 days 17,250 5.54 18,628 1.14 19,575 UITO A B D E F G H 9.06 8 days 25 days K L 49 days 49.2% 59.5% 14.1% 9.2% 9.7% -1.0% 6.64 0.45 20,000 20,330 19,450 K L 233 days 53.0% 23.7% 15.7% 5.60 49 days Industry 17 FINANCIAL PERFORMANCE SUMMARY Year 18 3,073 A B B D E Income Statement Data ($000s) Cost of Warehouse Marketing Admin Pairs Sold Expenses Expenses Expenses 727,262 122,668 259,186 35,834 865,436 137,152 287,194 43.828 201,027 46,850 149,080 21,549 457,182 243,640 32,835 502,148 86,837 216,315 27,081 488,120 90,921 224,084 29,834 699,628 107,889 185,375 37,832 330,552 59,997 129,971 22,836 482,209 73,106 177,709 25,301 552,447 77,801 112,558 28,083 290,028 51,653 133,999 172,490 160,463 480,711 84,313 189,965 29,455 Net Sales Revenues Internet Wholesale P-label Total 479,604 1,131,010 42,711 1,653,325 513,135 1,096,721 228,828 1,908,761 199,834 279,512 25,995 506,310 382,415 703,855 102,468 1,231,198 316,365 665,112 37,489 1,068,146 778,365 33,507 1,181,630 348,806 945,363 154,676 1,448,845 213,335 368,435 77,454 659,224 232,727 616,852 134,262 983,841 240,582 611,091 110,511 962,184 192,140 347,087 0 539,227 216.838 234,392 0 451,230 307,226 648,150 78,992 1,049,493 100,366 350,930 Operating Interest Profit Exp (Inc) 508,375 575,151 5,793 87,804 2,118 397,175 411 235,765 -1,388 -1,937 418,121 -2,253 115,868 9,339 225,516 3,918 191,295 12,264 42,712 178 34,148 46,412 265,050 6,494 348,665 Income Net Taxes Profit 149,791 349,511 170,507 397,851 25,406 59,280 117,839 274,957 69,011 161,027 233,150 126,112 294,262 31,319 73,079 65,150 152,016 53,709 125,322 12,760 29,774 0 76,794 178,164 99,922 G H I J L GHIOTTO J L 20,835 27,614 56,515 -12,264 Selected Balance Sheet Data Cash Assets Current Fixed Total Assets Assets Assets 514,734 616,994 1,131,728 518,961 852,152 1,371,113 130,105 323,391 453,496 230,833 640,415 871,248 450,057 381,931 831,988 503,849 1,108,357 616,623 810,622 1,427,245 152,422 453,926 606,348 263,165 480,822 743,987 438,884 707,666 277,573 281,024 558,597 206,905 423,988 630,893 352,889 517,333 870,222 On Hand 158,268 100,726 49,048 7,045 218,369 371,108 274,454 64,645 0 97,839 0 ($000s) Liabilities Current Long-Term Liabilities Loans 49, 105 0 81,114 0 17,981 6,000 48,896 0 38.199 38,199 0 44 963 n 44,963 61,723 62,370 35,000 49,440 60,000 19,000 36,477 0 414,098 0 83,771 10,000 Total Liabilities 49,105 81,114 23,981 48,896 38,199 683,702 121,227 AUHITIMO 604,508 Shareholder Equity Beginning Stock Sale Earnings Ending Equity (Purchase) Retained Equity 975,609 -242,497 349,511 1,082,623 1,113,147 -210,390 387,242 1,289,999 380,160 0 49,355 429,515 878,321 -330,926 274,957 822,352 -11,140 793,789 863,816 -33,572 233,150 1,063,394 1,178,510 187,012 1,365,522 435,899 73,079 508,978 605,647 -96,291 125,191 634,547 -7,097 125,322 587,777 492,346 29,774 522,120 229,059 0 -12,264 216,795 692,147 -77,659 161,963 776,451 44,963 61,723 10,007 G FAHITIMO 268,782 97,370 109,440 119,889 36,477 414,098 93,771 100,889 469,552 112,626 Selected Financial Statistics B D B D E F G UWUIHY Profitability Measures Gross Operating Net Profit Profit Profit Margin Margin Margin 56.0% 30.7% 21.1% 54.7% 30.1% 20.8% 60.3% 17.3% 11.7% 62.9% 32.3% 22.3% 53.0% 22.1% 15.1% 58.7% 29.5% 19.7% 51.7% 28.9% 20.3% 49.9% 17.6% 11.1% 51.0% 22.9% 15.5% 42.6% 19.9% 13.0% 46.2% 7.9% 5.5% 61.8% 7.6% -2.7% 54.2% 25.3% 17.0% Dividend Data Credit Rating Measures Shares Div. Per Total Div. Payout Interest Debt to Default Risk of Stock Share Payment (percent of Coverage Assets Risk of Current Days of Outstanding ($/share) ( ($000s) net profit) Ratio Ratio Ratio Default Ratio Inventory D00s of shares) 0.00 0 0.0% 165.43 0.04 29.05 Low 10.48 33 days 18,000 0.50 10,609 2.7% 99.28 0.06 16.97 Low 6.40 47 days 21,217 0.50 9,925 16.7% 41.46 0.05 6.66 Low 7.24 9 days 19,850 0.00 0 0.0% 966.36 0.06 33.39 Low 4.72 21 days 17,630 2.00 39,800 24.7% 1,000.00 0.05 1,000.00 Low 11.78 47 days 19,900 0.00 0 0.0% 1,000.00 0.04 27.82 Low 13.44 25 days 18,850 5.50 107,250 36.4% 1,000.00 0.04 1,000.00 Low 9.99 40 days 19,500 0.00 0 0.0% 12.41 0.16 1.46 High 2.44 39 days 17,250 1.50 26,825 17.6% 57.56 0.15 25.97 Low 5.32 10 days 17,883 0.00 0 0 0.0% 15.60 0.17 0.98 High 2.66 66 days 19,485 0.00 0 0.0% 239.96 0.07 5.22 Low 7.61 118 days 20,000 0.00 0 0 0.0% 0.74 0.66 0.05 High 0.50 339 days 20,330 0.83 16,201 8.2% 177.64 0.13 12.30 6.88 66 days 19,158 F TUITO H J L J K L