

Answered step by step
Verified Expert Solution
Question
1 Approved Answer
Create energy level diagram for Cu using the above tables. also find the range of em spectrum does this level lie. VALUES OF MELTING POINT
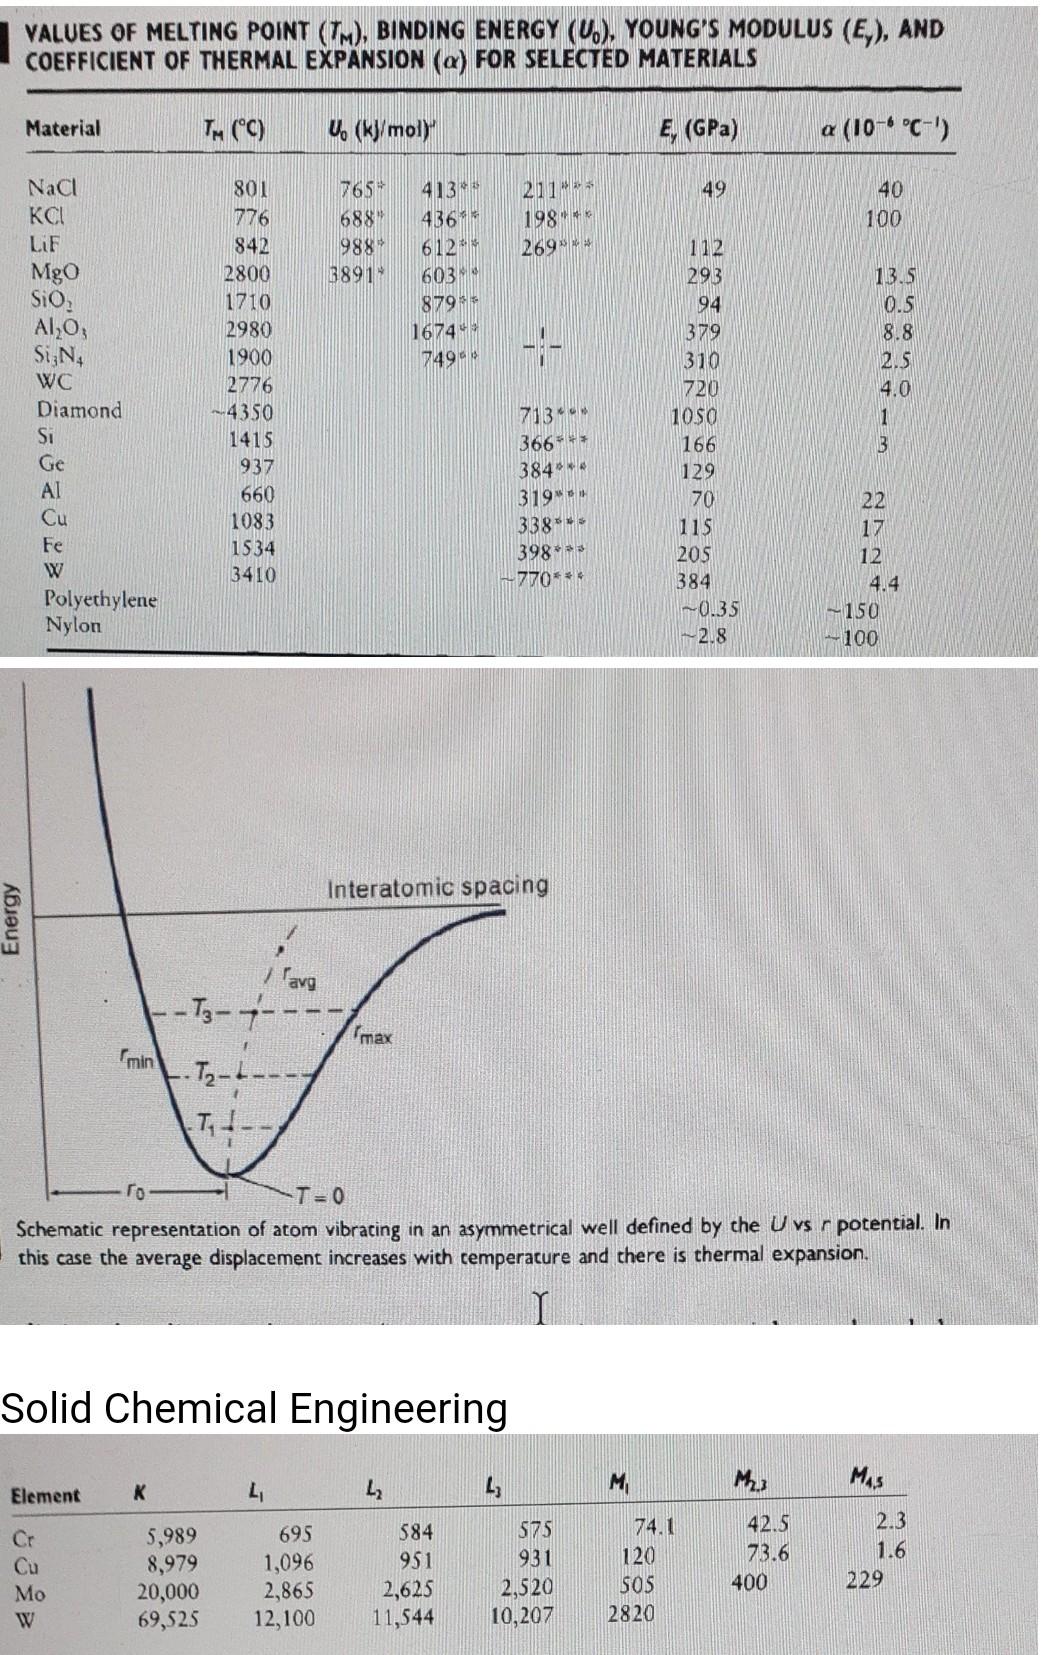
Create energy level diagram for Cu using the above tables. also find the range of em spectrum does this level lie.
VALUES OF MELTING POINT (IM), BINDING ENERGY (V.), YOUNG'S MODULUS (E), AND COEFFICIENT OF THERMAL EXPANSION (a) FOR SELECTED MATERIALS Material TM (C) U (kymoly , (GPa) a (10-6 C-') 49 765 688 988 3891 2112* 198 2699 40 100 413 436 612 603. 8794 16744 749 13.5 0.5 8.8 Nac LIF MgO SIO ALLO SizN WC Diamond Si Ge AI Cu Fe W Polyethylene Nylon 801 776 842 2800 1710 2980 1900 2776 -4350 1415 937 660 1083 1534 3410 4.0 www.lee 112 293 94 379 310 720 1050 166 129 70 115 205 384 0.35 2.8 713 0 366 384 319 3389 39833 770*** 22 17 12 4.4 -150 100 Interatomic spacing Energy max Farg --T3-7-- min T-I--- TI- 1 T=0 Schematic representation of atom vibrating in an asymmetrical well defined by the Uvs r potential. In this case the average displacement increases with temperature and there is thermal expansion. I Solid Chemical Engineering MAS Element K M L, L2 Cr Cu Mo W 5,989 8,979 20,000 69,525 695 1,096 2,865 12,100 584 951 2,625 11,544 575 931 2,520 10,207 74.1 120 SOS 2820 42.5 73.6 400 2.3 1.6 229Step by Step Solution
There are 3 Steps involved in it
Step: 1

Get Instant Access to Expert-Tailored Solutions
See step-by-step solutions with expert insights and AI powered tools for academic success
Step: 2

Step: 3
Ace Your Homework with AI
Get the answers you need in no time with our AI-driven, step-by-step assistance
Get Started
Understanding Rheology
Authors: Faith A. Morrison
1st Edition
0195141660, 9780195141665