

Question
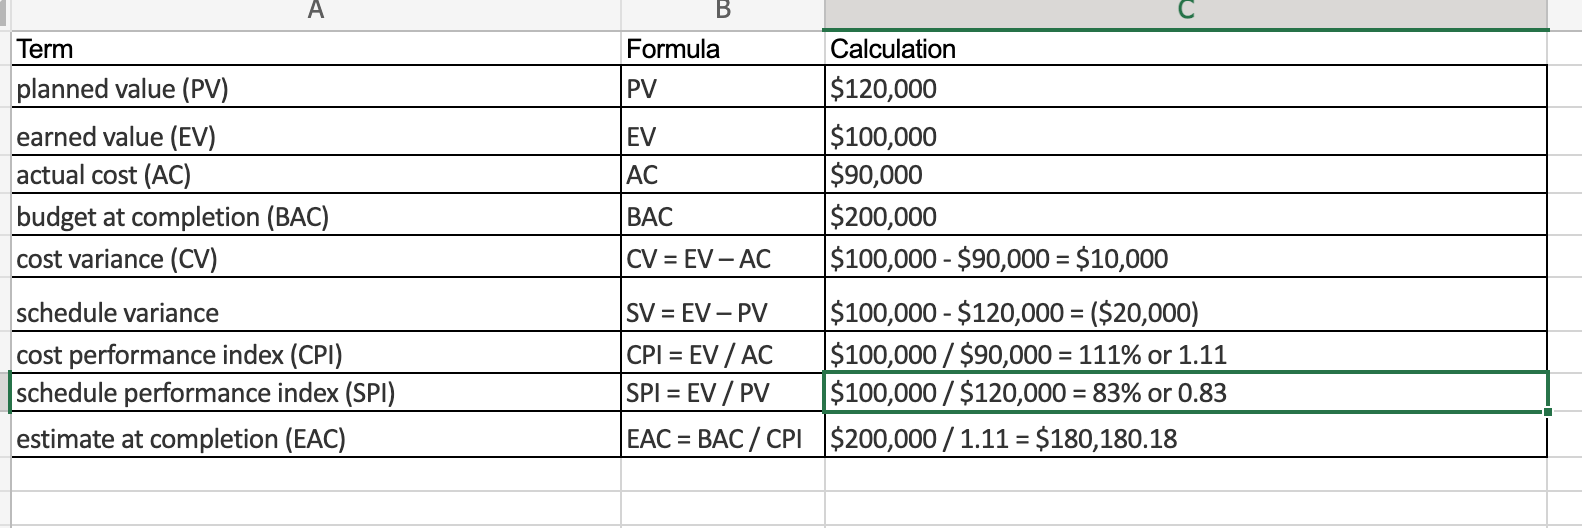
Create Expectation Management Matrix in a table format using the data from your previous Assignment # 5. Use as a sample Table 13-3 on page
Create Expectation Management Matrix in a table format using the data from your previous Assignment # 5. Use as a sample Table 13-3 on page 549 of Schwalbe's textbook. You could modify and extend with additional measures of success, such as achieving customers' satisfaction, exceeding ROI projections, and accomplishing great quality expectations. Write one page Memo to the stakeholders introducing to them the Expectation Management Matrix.
Step by Step Solution
There are 3 Steps involved in it
Step: 1

Get Instant Access to Expert-Tailored Solutions
See step-by-step solutions with expert insights and AI powered tools for academic success
Step: 2

Step: 3
Ace Your Homework with AI
Get the answers you need in no time with our AI-driven, step-by-step assistance
Get Started
Creating Financial Value A Guide For Senior Executives With No Finance Background
Authors: Malcolm Allitt
1st Edition
1472922719, 978-1472922717