Answered step by step
Verified Expert Solution
Question
1 Approved Answer
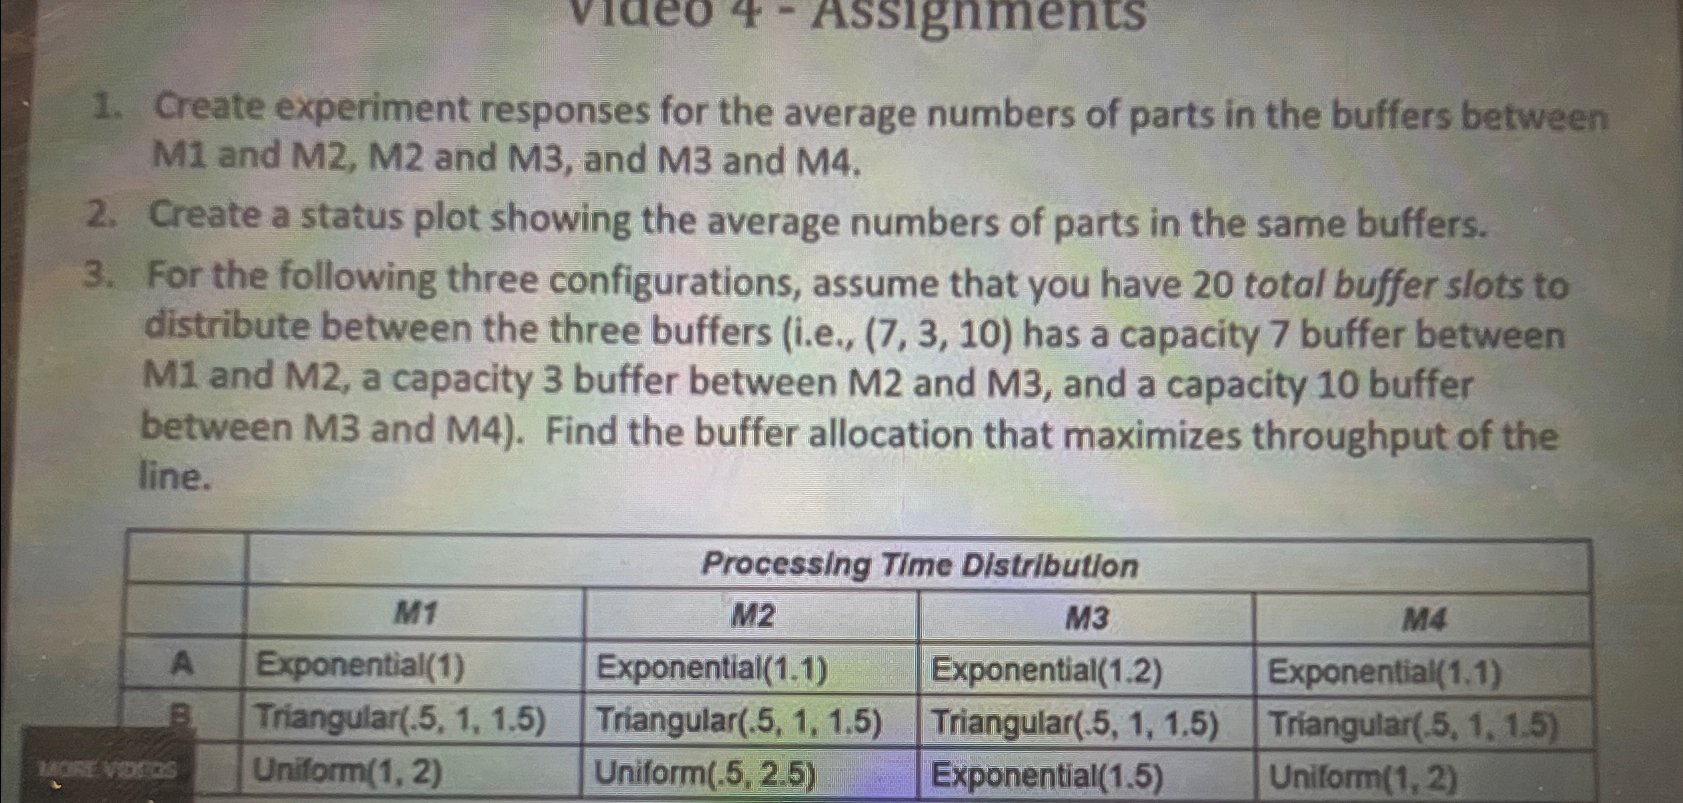
Create experiment responses for the average numbers of parts in the buffers between M 1 and M 2 , M 2 and M 3 ,
Create experiment responses for the average numbers of parts in the buffers between and and and and
Create a status plot showing the average numbers of parts in the same buffers.
For the following three configurations, assume that you have total buffer slots to distribute between the three buffers ie has a capacity buffer between M and M a capacity buffer between M and M and a capacity buffer between M and M Find the buffer allocation that maximizes throughput of the line.
tableProcessing Time DistributlonMMMMAExponentialExponentialExponentialExponentialBTriangularTriangularTriangularTriangularprasUniformUniformExponentialUniform

Step by Step Solution
There are 3 Steps involved in it
Step: 1

Get Instant Access to Expert-Tailored Solutions
See step-by-step solutions with expert insights and AI powered tools for academic success
Step: 2

Step: 3

Ace Your Homework with AI
Get the answers you need in no time with our AI-driven, step-by-step assistance
Get Started


