

Answered step by step
Verified Expert Solution
Question
1 Approved Answer
Create line graphs reflecting the prices of each commodity over time. In [ 4 ] : # you will need to use functions from the
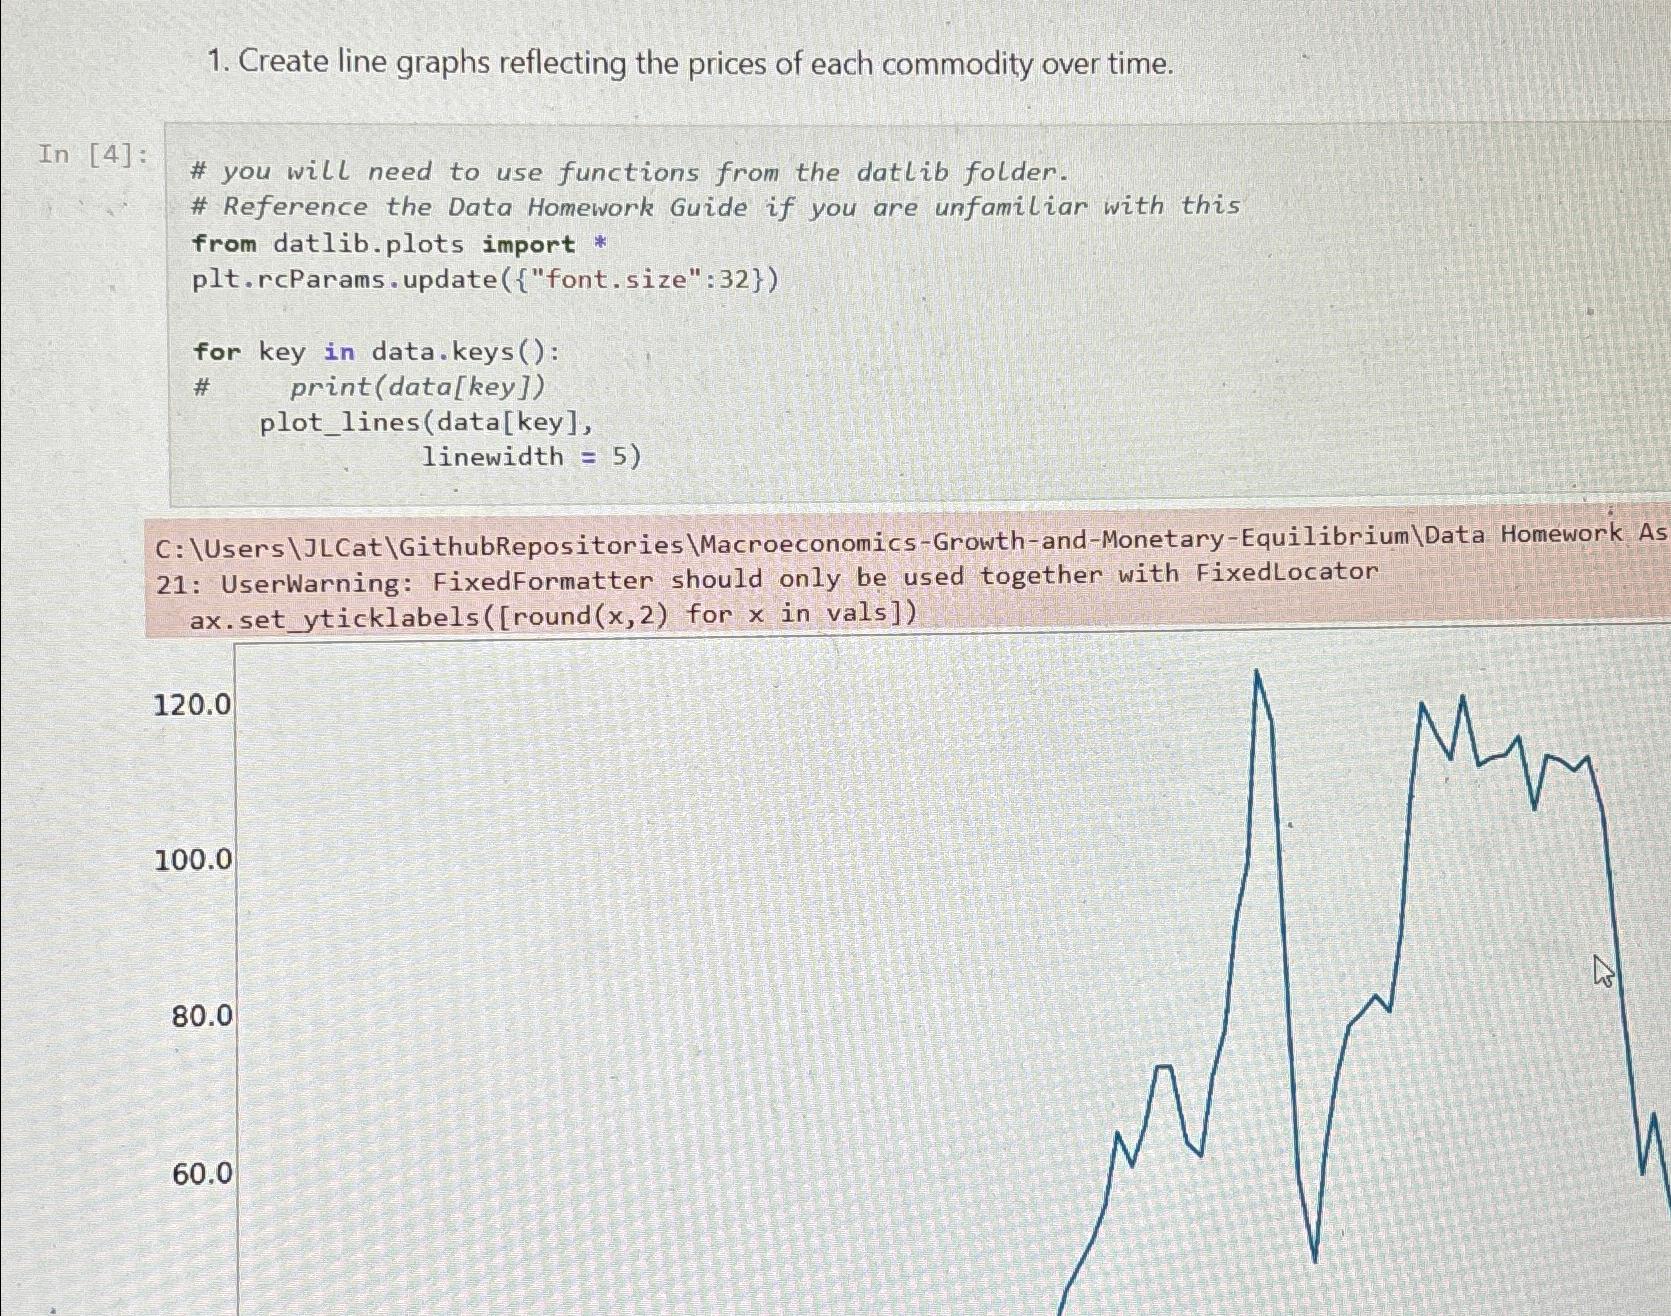
Create line graphs reflecting the prices of each commodity over time.
In :
# you will need to use functions from the datlib folder.
# Reference the Data Homework Guide if you are unfamiliar with this
from datlib.plots import
pltrcParams.update "font.size":
for key in data.keys:
# print datakey
plotlinesdatakey
linewidth
C: UsersJLCatGithubRepositories MacroeconomicsGrowthandMonetaryEquilibrium Data Homework As : UserWarning: FixedFormatter should only be used together with FixedLocator axsetyticklabelsround for in vals
Step by Step Solution
There are 3 Steps involved in it
Step: 1

Get Instant Access to Expert-Tailored Solutions
See step-by-step solutions with expert insights and AI powered tools for academic success
Step: 2

Step: 3
Ace Your Homework with AI
Get the answers you need in no time with our AI-driven, step-by-step assistance
Get Started
Database Systems For Advanced Applications Dasfaa 2022 International Workshops Bdms Bdqm Gdma Iwbt Maqtds And Pmbd Virtual Event April 11 14 2022 Proceedings Lncs 13248
Authors: Uday Kiran Rage ,Vikram Goyal ,P. Krishna Reddy
1st Edition
3031112164, 978-3031112164