

Answered step by step
Verified Expert Solution
Question
1 Approved Answer
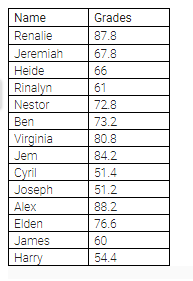
Create Normal Curve using Microsoft Excel with the given data set below. As much as possible, be creative in presenting your chart. it should have
- Create Normal Curve using Microsoft Excel with the given data set below.
- As much as possible, be creative in presenting your chart.
it should have the following grade, z-distribution (which is the norm.dist), mean and standard deviation.
Step by Step Solution
There are 3 Steps involved in it
Step: 1

Get Instant Access to Expert-Tailored Solutions
See step-by-step solutions with expert insights and AI powered tools for academic success
Step: 2

Step: 3
Ace Your Homework with AI
Get the answers you need in no time with our AI-driven, step-by-step assistance
Get Started
Algebra And Trigonometry, Enhanced
Authors: Cynthia Y Young
4th Edition
1119320860, 9781119320869