

Answered step by step
Verified Expert Solution
Question
1 Approved Answer
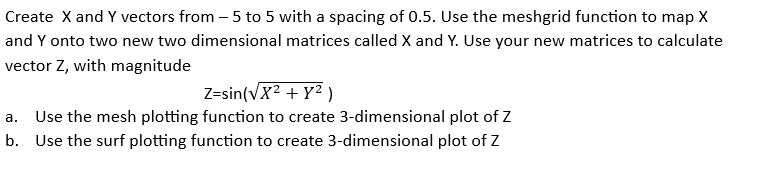
Create x and Y vectors from - 5 to 5 with a spacing of 0 . 5 . Use the meshgrid function to map x
Create and vectors from to with a spacing of Use the meshgrid function to map
and onto two new two dimensional matrices called and Use your new matrices to calculate
vector Z with magnitude
a Use the mesh plotting function to create dimensional plot of
b Use the surf plotting function to create dimensional plot of
Step by Step Solution
There are 3 Steps involved in it
Step: 1

Get Instant Access to Expert-Tailored Solutions
See step-by-step solutions with expert insights and AI powered tools for academic success
Step: 2

Step: 3
Ace Your Homework with AI
Get the answers you need in no time with our AI-driven, step-by-step assistance
Get Started
Advances In Spatial And Temporal Databases 11th International Symposium Sstd 2009 Aalborg Denmark July 8 10 2009 Proceedings Lncs 5644
Authors: Nikos Mamoulis ,Thomas Seidl ,Kristian Torp ,Ira Assent
2009th Edition
3642029817, 978-3642029813