Answered step by step
Verified Expert Solution
Question
1 Approved Answer
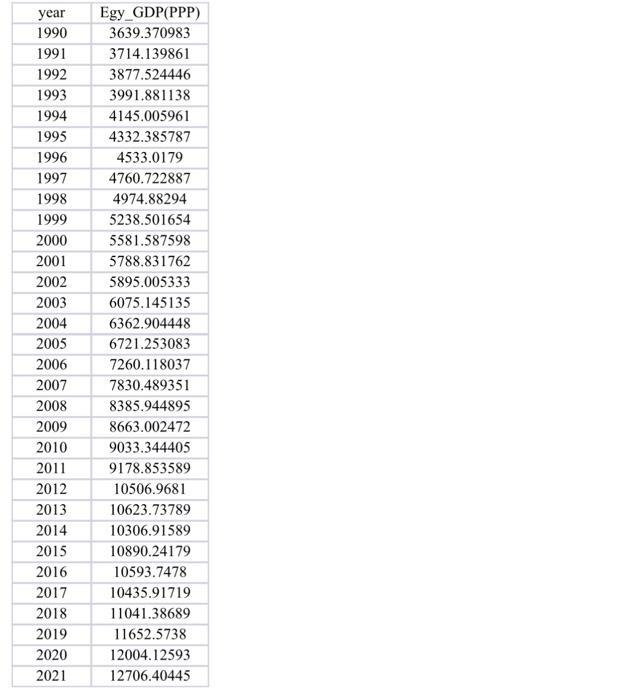
create XY plot of the GDP per capita (PPP) in Egypt over 1990 - 2021. year Egy_GDP(PPP) 1990 3639.370983 1991 3714.139861 1992 3877.524446 1993 3991.881138
create XY plot of the GDP per capita (PPP) in Egypt over 1990 - 2021.


year Egy_GDP(PPP) 1990 3639.370983 1991 3714.139861 1992 3877.524446 1993 3991.881138 1994 4145.005961 1995 4332.385787 1996 4533.0179 4760.722887 4974.88294 5238.501654 5581.587598 5788.831762 5895.005333 6075.145135 6362.904448 6721.253083 7260.118037 7830.489351 8385.944895 8663.002472 9033.344405 9178.853589 1997 1998 1999 2000 2001 2002 2003 2004 2005 2006 2007 2008 2009 2010 2011 2012 2013 2014 2015 2016 2017 2018 2019 2020 2021 10506.9681 10623.73789 10306.91589 10890.24179 10593.7478 10435.91719 11041.38689 11652.5738 12004.12593 12706.40445
Step by Step Solution
★★★★★
3.45 Rating (158 Votes )
There are 3 Steps involved in it
Step: 1
Step 1 of 1 Explanation To create an XY plot of the GDP per capita PPP in Egypt over 19902021 we can ...
Get Instant Access to Expert-Tailored Solutions
See step-by-step solutions with expert insights and AI powered tools for academic success
Step: 2

Step: 3

Ace Your Homework with AI
Get the answers you need in no time with our AI-driven, step-by-step assistance
Get Started


