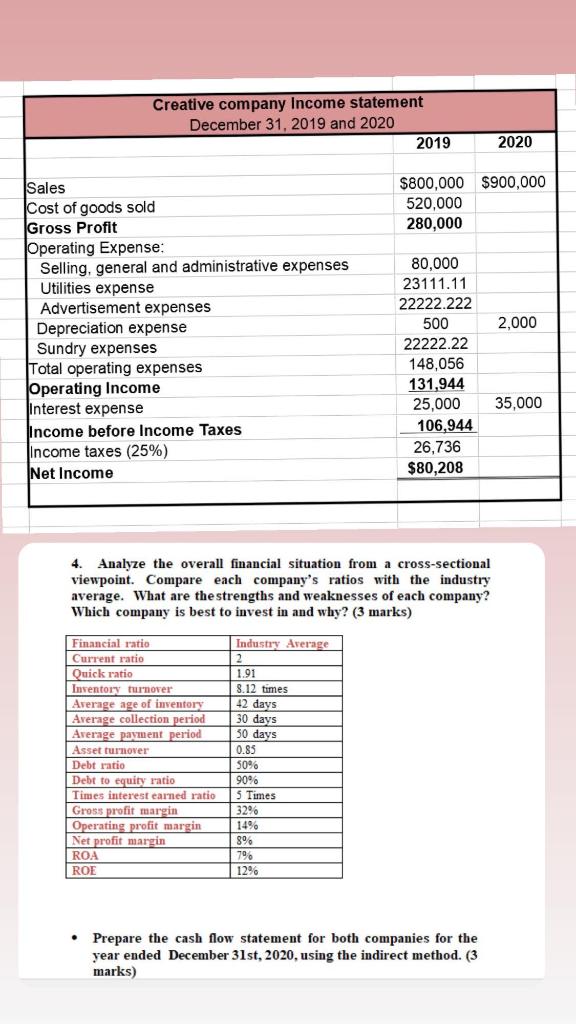
Creative company Income statement December 31, 2019 and 2020 2019 2020 $800,000 $900,000 520,000 280,000 2,000 Sales Cost of goods sold Gross Profit Operating Expense: Selling, general and administrative expenses Utilities expense Advertisement expenses Depreciation expense Sundry expenses Total operating expenses Operating Income Interest expense Income before Income Taxes Income taxes (25%) Net Income 80,000 23111.11 22222.222 500 22222.22 148,056 131,944 25,000 106,944 26,736 $80,208 35,000 4 Analyze the overall financial situation from a cross-sectional viewpoint. Compare each company's ratios with the industry average. What are the strengths and weaknesses of each company? Which company is best to invest in and why? (3 marks) Financial ratio Current ratio Quick ratio Inventory turnover Average age of inventory Average collection period Average payment period Asset turnover Debt ratio Debt to equity ratio Times interest earned ratio Gross profit margin Operating profit margin Net profit margin ROA ROE Industry Average 2 1.91 8.12 times 42 days 30 days 30 days 0.85 50% 90% Times 32 14% 89 79 12% Prepare the cash flow statement for both companies for the year ended December 31st, 2020, using the indirect method. (3 marks) Creative company Income statement December 31, 2019 and 2020 2019 2020 $800,000 $900,000 520,000 280,000 2,000 Sales Cost of goods sold Gross Profit Operating Expense: Selling, general and administrative expenses Utilities expense Advertisement expenses Depreciation expense Sundry expenses Total operating expenses Operating Income Interest expense Income before Income Taxes Income taxes (25%) Net Income 80,000 23111.11 22222.222 500 22222.22 148,056 131,944 25,000 106,944 26,736 $80,208 35,000 4 Analyze the overall financial situation from a cross-sectional viewpoint. Compare each company's ratios with the industry average. What are the strengths and weaknesses of each company? Which company is best to invest in and why? (3 marks) Financial ratio Current ratio Quick ratio Inventory turnover Average age of inventory Average collection period Average payment period Asset turnover Debt ratio Debt to equity ratio Times interest earned ratio Gross profit margin Operating profit margin Net profit margin ROA ROE Industry Average 2 1.91 8.12 times 42 days 30 days 30 days 0.85 50% 90% Times 32 14% 89 79 12% Prepare the cash flow statement for both companies for the year ended December 31st, 2020, using the indirect method


