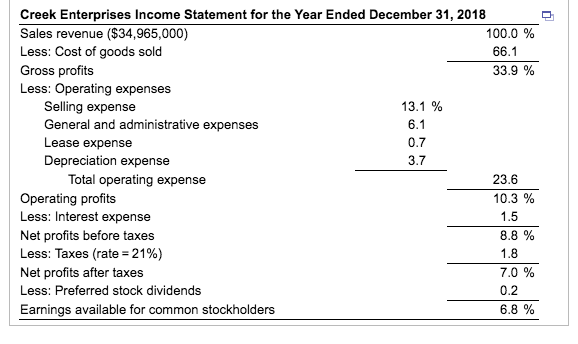

Creek Enterprises Income Statement for the Year Ended December 31, 2018 100.0 % Sales revenue ($34,965,000) Less: Cost of goods sold 66.1 33.9 % Gross profits Less: Operating expenses Selling expense General and administrative expenses Lease expense 13.1 % 6.1 0.7 3.7 Depreciation expense Total operating expense 23.6 10.3 % Operating profits Less: Interest expense 1.5 8.8 % Net profits before taxes 1.8 Less: Taxes (rate= 21 %) 7,0% Net profits after taxes 0.2 Less: Preferred stock dividends 6.8 % Earnings available for common stockholders Interpreting liquidity and activity ratios The table, EEB, shows key financial data for three firms that compete in the consumer products market: Procter &Gamble, Colgate-Palmolive, and Clorox. a. Calculate each of the following ratios for all three companies: current ratio, quick ratio, inventory turnover, average collection period, total asset turnover b. What company is in the position of having greatest liquidity? c. Would you say that the three companies exhibit similar performance or quite different performance in terms of collecting receivables? Why do you think that might be? d. Which company has the most rapid inventory turnover? Which company appears to be least efficient in terms of total asset turnover? Are your answers to those questions a ittle surprising? If a company is best at inventory turnover and worst at total asset turnover, what do you think that means? a. For the three companies, the current ratios are: (Round to three decimal places.) Procter and Gamble Colgate-Palmolive Clorox Current ratio Creek Enterprises Income Statement for the Year Ended December 31, 2018 100.0 % Sales revenue ($34,965,000) Less: Cost of goods sold 66.1 33.9 % Gross profits Less: Operating expenses Selling expense General and administrative expenses Lease expense 13.1 % 6.1 0.7 3.7 Depreciation expense Total operating expense 23.6 10.3 % Operating profits Less: Interest expense 1.5 8.8 % Net profits before taxes 1.8 Less: Taxes (rate= 21 %) 7,0% Net profits after taxes 0.2 Less: Preferred stock dividends 6.8 % Earnings available for common stockholders Interpreting liquidity and activity ratios The table, EEB, shows key financial data for three firms that compete in the consumer products market: Procter &Gamble, Colgate-Palmolive, and Clorox. a. Calculate each of the following ratios for all three companies: current ratio, quick ratio, inventory turnover, average collection period, total asset turnover b. What company is in the position of having greatest liquidity? c. Would you say that the three companies exhibit similar performance or quite different performance in terms of collecting receivables? Why do you think that might be? d. Which company has the most rapid inventory turnover? Which company appears to be least efficient in terms of total asset turnover? Are your answers to those questions a ittle surprising? If a company is best at inventory turnover and worst at total asset turnover, what do you think that means? a. For the three companies, the current ratios are: (Round to three decimal places.) Procter and Gamble Colgate-Palmolive Clorox Current ratio


