

Question: Crickets make their chirping sound by sliding one wing cover very rapidly back and forth over the other. Biologists have long been aware that there

![the number of years it is stored [159]. Age, .1: (years) Proof,](https://dsd5zvtm8ll6.cloudfront.net/si.experts.images/questions/2024/11/672eecc13a2eb_513672eecc121ddb.jpg)
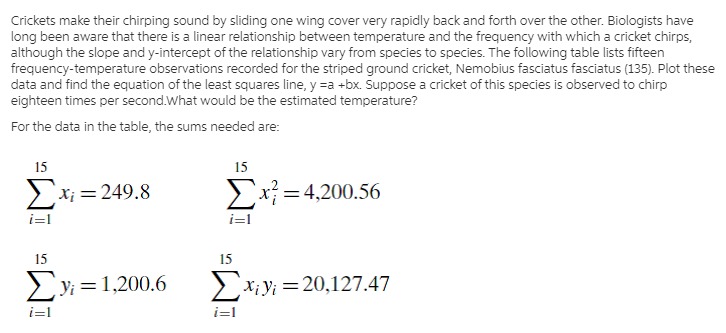
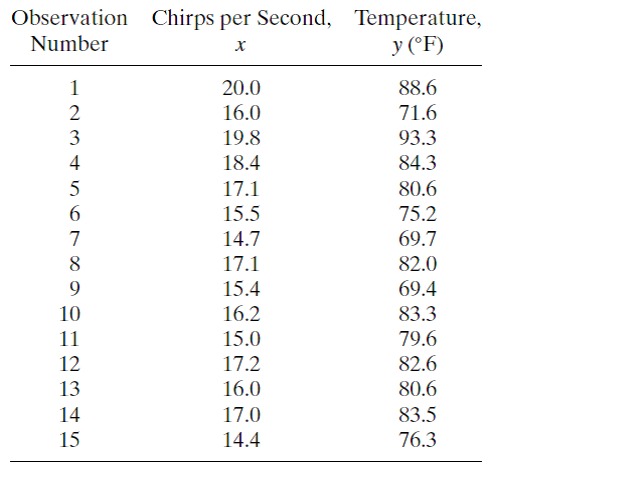
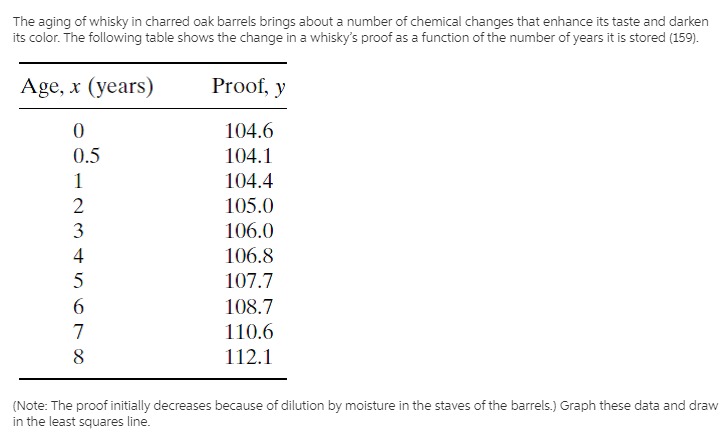
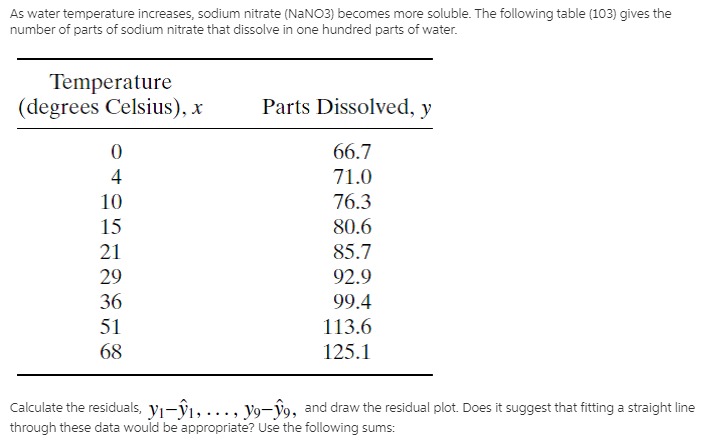
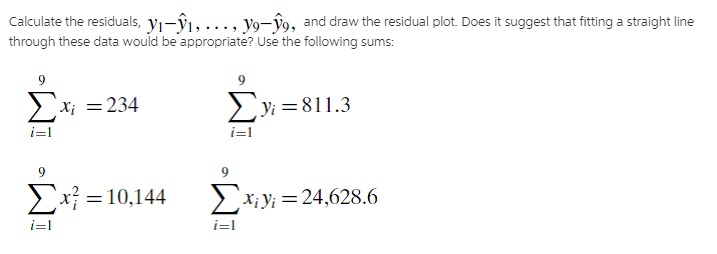
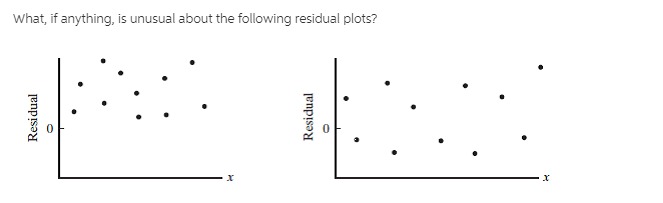
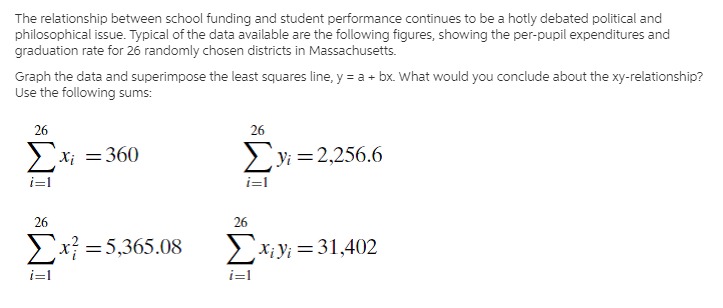
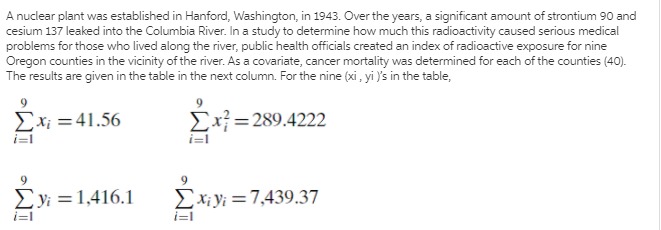
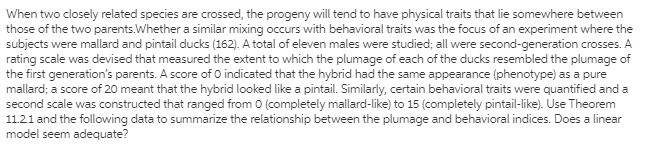
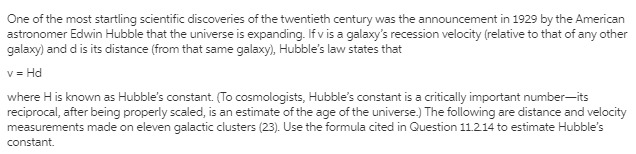
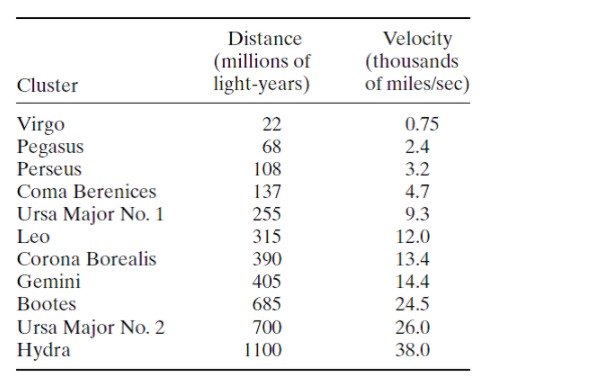
Crickets make their chirping sound by sliding one wing cover very rapidly back and forth over the other. Biologists have long been aware that there is a linear relationship between temperature and the frequency with which a cricket chirps, although the slope and y-intercept of the relationship vary from species to species. The following table lists fifteen frequency-temperature observations recorded for the striped ground cricket, Nemobius fasciatus fasciatus (135). Plot these data and find the equation of the least squares line, y =a +bx. Suppose a cricket of this species is observed to chirp eighteen times per second.What would be the estimated temperature? For the data in the table, the sums needed are: 15 15 E xi = 249.8 x; =4,200.56 i=1 15 Exi =1,200.6 xi yi = 20,127.47 i=1 i=1\fThe aging of whisky in charred oak: barrels brings about a number of chemical changes that enhance its taste and darken its color. 'lhe following table shows the change in a whisky's proof as a function of the number of years it is stored [159]. Age, .1: (years) Proof, 3; 104. 6 104. 1 104. 4 105.0 106. 0 106. 8 101.? 108. T 1 10.6 1 12. 1 mummhmrowp: U'I {Note: The proof initially decreases because of dilution by moisture in the states ofthe barrels.) Graph these data and draw in the least squares line. As water temperature increases, sodium nitrate {NaNU-E} becomes more sotuble. The following table {103) gives the number of parts of sodium nitrate that dissolve in one hundred parts of water. Temperature (degrees Celsius), 1' Parts Dissolved, y 0 66.7 4 T11} 10 76.3 15 80.6 21 85.? 29 92.9 36 99.4 51 113.6 68 125.1 Calculate the residuals, y] j}l , , _ _ , Jigj}? , and draw the residual plot. Does it suggest that tting a straight line through these data would be appropriate? Use the following sums: Calculate the residuals, V1-V1, . . ., Vo-Vo, and draw the residual plot. Does it suggest that fitting a straight line through these data would be appropriate? Use the following sums: 9 X, = 234 Cy =811.3 i=1 9 = 10,144 Xi yi = 24,628.6 i=1What, if anything, is unusual about the following residual plots? Residual Residual 0 0 - XThe relationship between school funding and student performance continues to be a hotljir debated political and philosophical issue. Typical of the data available are the following figures; showing the perpupil expenditures and graduation rate fora randomly chosen districts in Massachusetts. Graph the data and superimpose the least so uares line, 3! = a + bx What would you conclude about the xii-relationship? Use the following sums: 26 26 Z I; = 360 2 y; = 2256.6 i=1 i=l 26 26 :2? =5,365.08 21\"\": 31,402 21 2] Spending per Pupil District (in 1000s). x Graduation Rate Dighton-Rehoboth $10.0 88.7 Duxbury $10.2 93.2 Tyngsborough $10.2 95.1 Lynnfield $10.3 94.0 Southwick-Tolland $10.3 88.3 Clinton $10.8 89.9 Athol-Royalston $11.0 67.7 Tantasqua $11.0 90.2 Ayer $11.2 95.5 Adams-Cheshire $11.6 75.2 Danvers $12.1 84.6 Lee $12.3 85.0 Needham $12.6 94.8 New Bedford $12.7 56.1 Springfield $12.9 54.4 Manchester Essex $13.0 97.9 Dedham $13.9 83.0 Lexington $14.5 94.0 Chatham $14.7 91.4 Newton $15.5 94.2 Blackstone Valley $16.4 97.2 Concord Carlisle $17.5 94.4 Pathfinder $18.1 78.6 Nantucket $20.8 87.6 Essex $22.4 93.3 Provincetown $24.0 92.3 Source: profiles doe.mass.edu/state-report/ppx.aspx.A nuclear plant was established in Hanford, Washington, in 1943. Over the years, a significant amount of strontium 90 and cesium 137 leaked into the Columbia River. In a study to determine how much this radioactivity caused serious medical problems for those who lived along the river, public health officials created an index of radioactive exposure for nine Oregon counties in the vicinity of the river. As a covariate, cancer mortality was determined for each of the counties (40). The results are given in the table in the next column. For the nine (xi , yi )'s in the table, 9 9 Xi =41.56 Ex, =289.4222 9 9 E yi = 1,416.1 Exi yi = 7,439.37When two closely related species are crossed, the progeny will tend to have physical traits that lie somewhere between those ofthe two parents-Whether a similar mixing occurs with behavioral traits was the focus of an experiment where the subjects were mallard and pintail ducks [1621.Atotal ofelelren males were studied: all were second-generation crosses. A rating scale was devised that measured the extent to which the plumage of each ofthe ducks resembled the plumage of the first generation's parents. A score of D indicated that the hybrid had the same appearance {phenotype} as a pure mallard; a score of 20 meant that the hybrid looked like a pintail. Similarly, certain behavioral traits were quantified and a second scale was constructed that ranged from D [completely mallard like} to 15 {completely pintail-Iilce]. Use Theorem 11.11 and the following data to summarize the relationship between the plumage and behavioral indices. Does a linear model seem adequate? \f\fOne of the most startling scientific discoveries of the twentieth century was the announcement in 1929 by the American astronomer Edwin Hubble that the universe is expanding. If vis a galaxy's recession velocity (relative to that of any other galaxy) and d is its distance (from that same galaxy), Hubble's law states that v = Hd where His known as Hubble's constant. (To cosmologists, Hubble's constant is a critically important number-its reciprocal, after being properly scaled, is an estimate of the age of the universe.) The following are distance and velocity measurements made on eleven galactic clusters (23). Use the formula cited in Question 11 2 14 to estimate Hubble's constant.Distance Velocity (millions of (thousands Cluster light-years) of miles/sec) Virgo 22 0.75 Pegasus 68 2.4 Perseus 108 3.2 Coma Berenices 137 4.7 Ursa Major No. 1 255 9.3 Leo 315 12.0 Corona Borealis 390 13.4 Gemini 405 14.4 Bootes 685 24.5 Ursa Major No. 2 700 26.0 Hydra 1100 38.0Reference: Question 11.2.14: In some regression situations, there are a priori reasons for assuming that the xy-relationship being approximated passes through the origin. If so, the equation to be fit to the (xi , yi )'s has the form y =bx. Use the least squares criterion to show that the "best" slope in that case is given by E xi Vi b = i=1 i=1
Step by Step Solution
There are 3 Steps involved in it

Get step-by-step solutions from verified subject matter experts