....................................
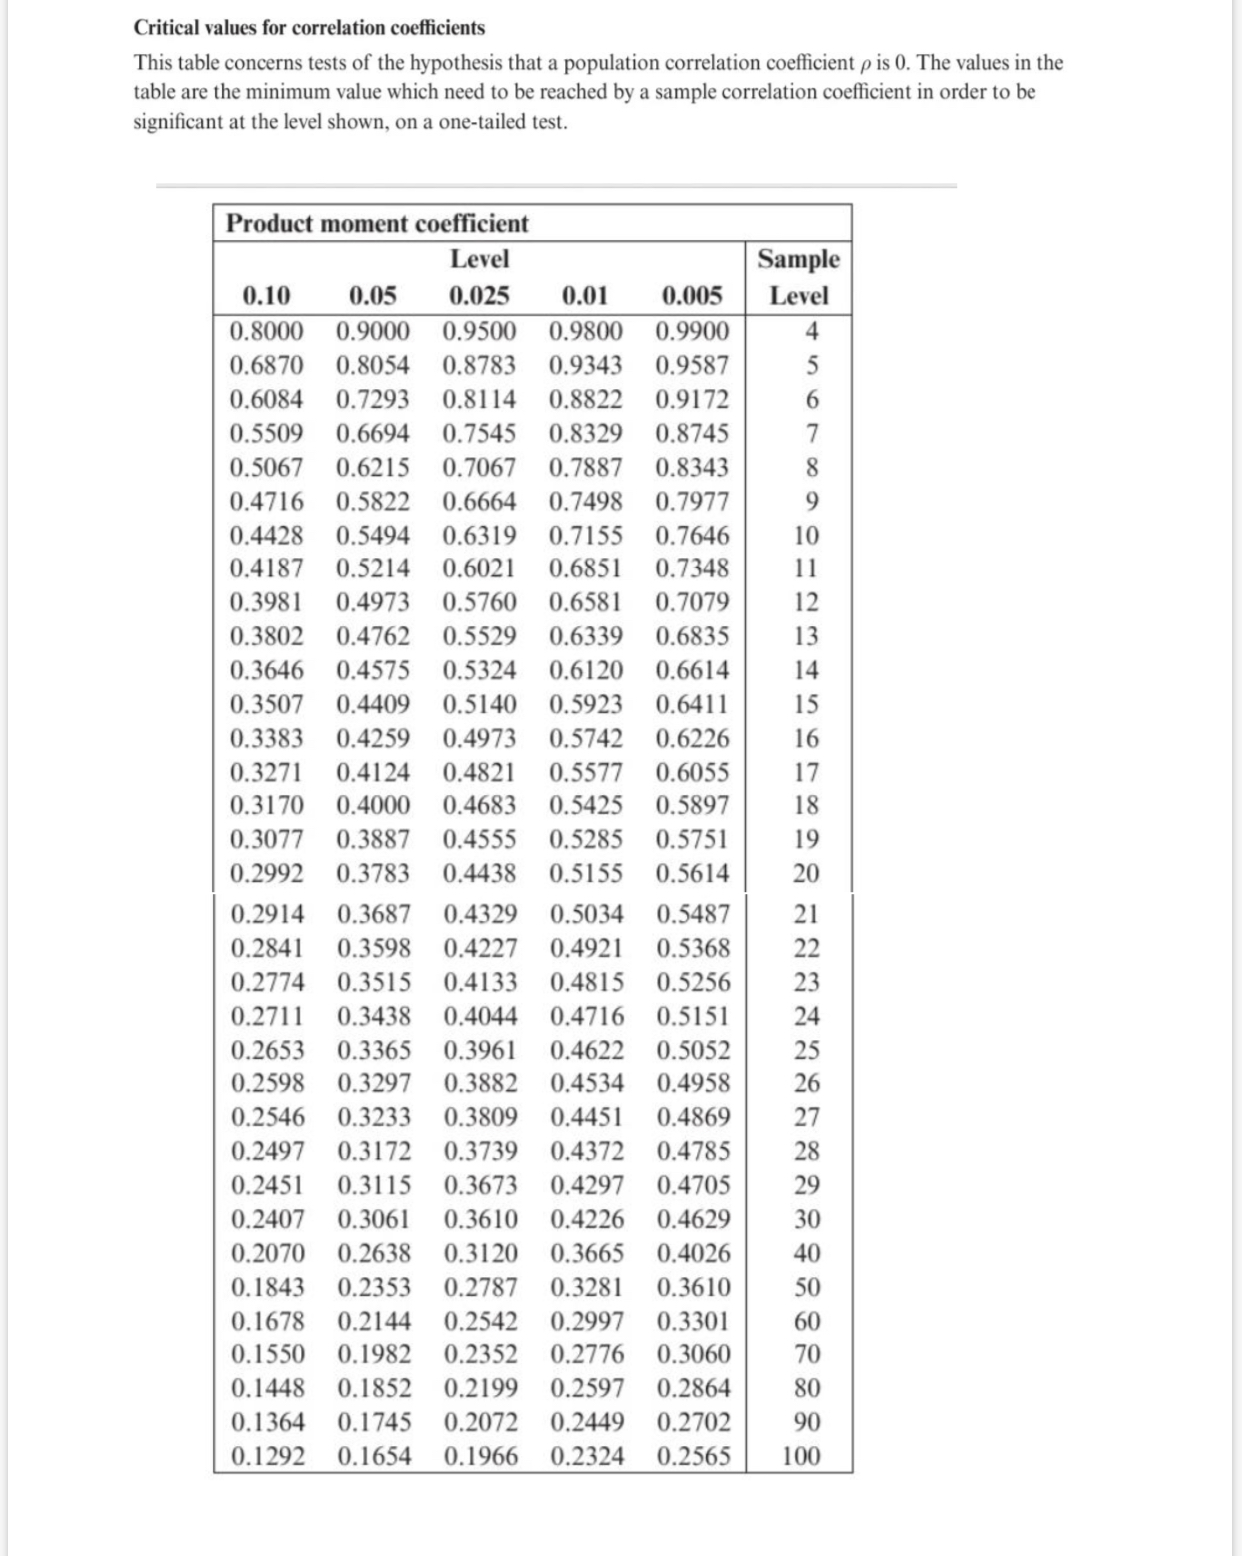
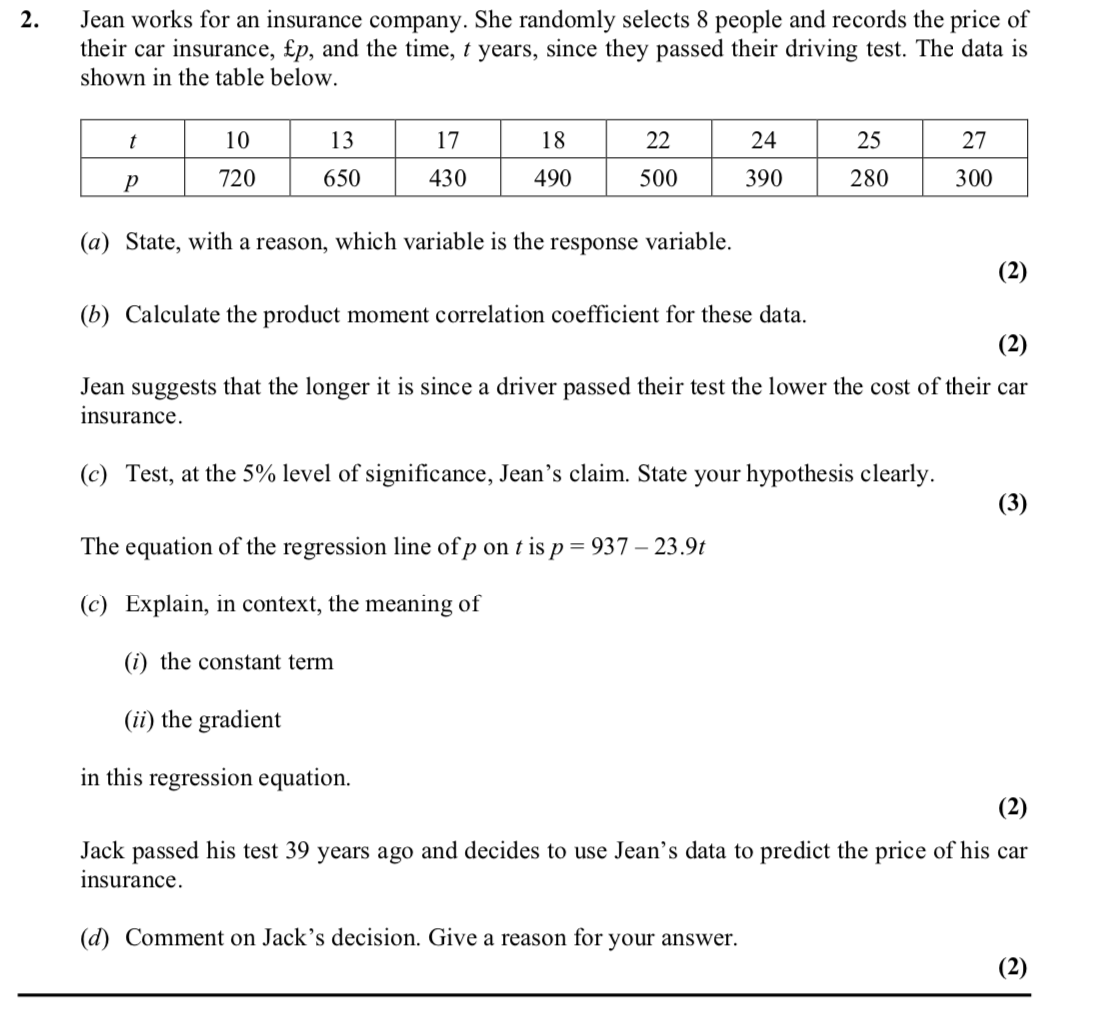
Critical values for correlation coefficients This table concerns tests of the hypothesis that a population correlation coefficient p is 0. The values in the table are the minimum value which need to be reached by a sample correlation coefficient in order to be significant at the level shown, on a one-tailed test. Product moment coefficient Level Sample 0.10 0.05 0.025 0.01 0.005 Level 0.8000 0.9000 0.9500 0.9800 0.9900 0.6870 0.8054 0.8783 0.9343 0.9587 0.6084 0.7293 0.8114 0.8822 0.9172 ur + 0.5509 0.6694 0.7545 0.8329 0.8745 0.5067 0.6215 0.7067 0.7887 0.8343 0.4716 0.5822 0.6664 0.7498 0.7977 0.4428 0.5494 0.6319 0.7155 0.7646 10 0.4187 0.5214 0.6021 0.6851 0.7348 11 0.3981 0.4973 0.5760 0.6581 0.7079 12 0.3802 0.4762 0.5529 0.6339 0.6835 13 0.3646 0.4575 0.5324 0.6120 0.6614 14 0.3507 0.4409 0.5140 0.5923 0.6411 15 0.3383 0.4259 0.4973 0.5742 0.6226 16 0.3271 0.4124 0.4821 0.5577 0.6055 17 0.3170 0.4000 0.4683 0.5425 0.5897 18 0.3077 0.3887 0.4555 0.5285 0.5751 19 0.2992 0.3783 0.4438 0.5155 0.5614 20 0.2914 0.3687 0.4329 0.5034 0.5487 21 0.2841 0.3598 0.4227 0.4921 0.5368 20 0.2774 0.3515 0.4133 0.4815 0.5256 23 0.2711 0.3438 0.4044 0.4716 0.5151 24 0.2653 0.3365 0.3961 0.4622 0.5052 25 0.2598 0.3297 0.3882 0.4534 0.4958 26 0.2546 0.3233 0.3809 0.4451 0.4869 27 0.2497 0.3172 0.3739 0.4372 0.4785 28 0.2451 0.3115 0.3673 0.4297 0.4705 29 0.2407 0.3061 0.3610 0.4226 0.4629 30 0.2070 0.2638 0.3120 0.3665 0.4026 40 0.1843 0.2353 0.2787 0.3281 0.3610 0.1678 0.2144 0.2542 0.2997 0.3301 60 0.1550 0.1982 0.2352 0.2776 0.3060 70 0.1448 0.1852 0.2199 0.2597 0.2864 80 0.1364 0.1745 0.2072 0.2449 0.2702 90 0.1292 0.1654 0.1966 0.2324 0.2565 1002. Jean works for an insurance company. She randomly selects 8 people and records the price of their car insurance, fp, and the time, t years, since they passed their driving test. The data is shown in the table below. 10 13 17 18 22 24 25 27 p 720 650 430 490 500 390 280 300 (a) State, with a reason, which variable is the response variable. (2) (b) Calculate the product moment correlation coefficient for these data. (2) Jean suggests that the longer it is since a driver passed their test the lower the cost of their car insurance . (c) Test, at the 5% level of significance, Jean's claim. State your hypothesis clearly. (3) The equation of the regression line of p on t is p = 937 - 23.9t (c) Explain, in context, the meaning of (i) the constant term (ii) the gradient in this regression equation. (2) Jack passed his test 39 years ago and decides to use Jean's data to predict the price of his car insurance. (d) Comment on Jack's decision. Give a reason for your answer. (2)