

Question
Crosby Company has provided the following comparative information: 20Y8 20Y7 20Y6 20Y5 20Y4 Net income $5,571,720 $3,714,480 $2,772,000 $1,848,000 $1,400,000 Interest expense 1,052,060 891,576 768,600
Crosby Company has provided the following comparative information:
| 20Y8 | 20Y7 | 20Y6 | 20Y5 | 20Y4 | ||||||
| Net income | $5,571,720 | $3,714,480 | $2,772,000 | $1,848,000 | $1,400,000 | |||||
| Interest expense | 1,052,060 | 891,576 | 768,600 | 610,000 | 500,000 | |||||
| Income tax expense | 1,225,572 | 845,222 | 640,320 | 441,600 | 320,000 | |||||
| Total assets (ending balance) | 29,378,491 | 22,598,839 | 17,120,333 | 12,588,480 | 10,152,000 | |||||
| Total stockholders equity (ending balance) | 18,706,200 | 13,134,480 | 9,420,000 | 6,648,000 | 4,800,000 | |||||
| Average total assets | 25,988,665 | 19,859,586 | 14,854,406 | 11,370,240 | 8,676,000 | |||||
| Average total stockholders' equity | 15,920,340 | 11,277,240 | 8,034,000 | 5,724,000 | 4,100,000 | |||||
You have been asked to evaluate the historical performance of the company over the last five years.
Selected industry ratios have remained relatively steady at the following levels for the last five years:
| 20Y420Y8 | ||
| Return on total assets | 19% | |
| Return on stockholders equity | 26% | |
| Times interest earned | 3.4 | |
| Ratio of liabilities to stockholders equity | 1.4 | |
Required:
1. Determine the following for the years 20Y4 through 20Y8 for each of the graphs below. Use the amounts given above in your calculations. Round to one decimal place.
a. Return on total assets: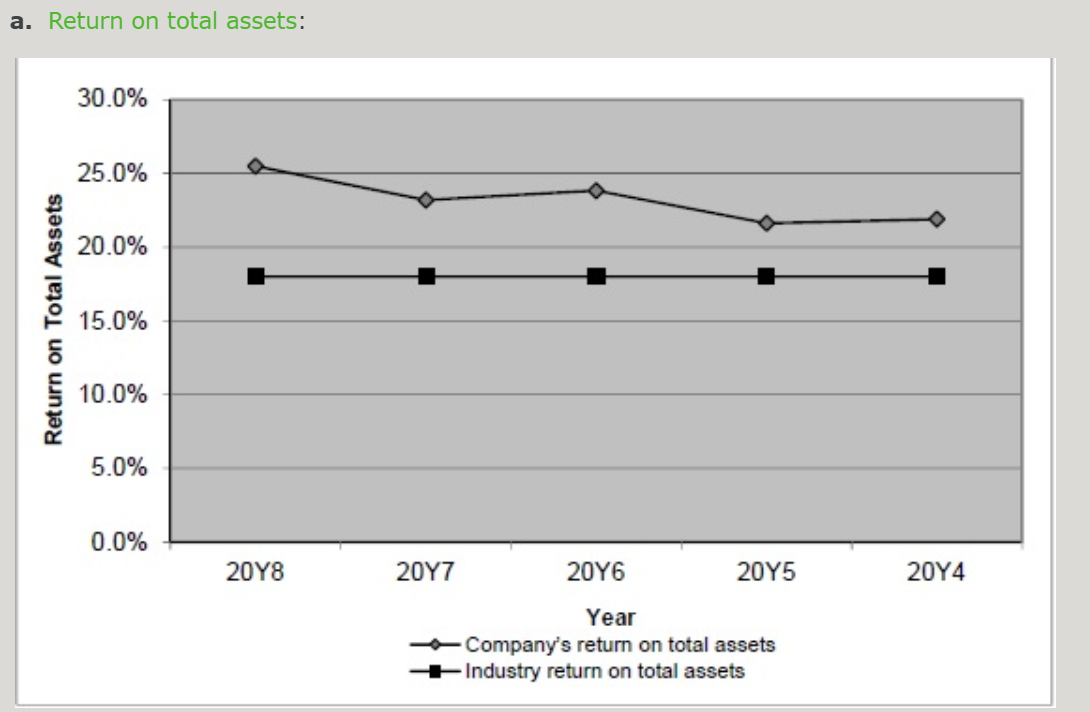
| 20Y8 | fill in the blank 1 % |
| 20Y7 | fill in the blank 2 % |
| 20Y6 | fill in the blank 3 % |
| 20Y5 | fill in the blank 4 % |
| 20Y4 | fill in the blank 5 % |
b. Return on stockholders equity: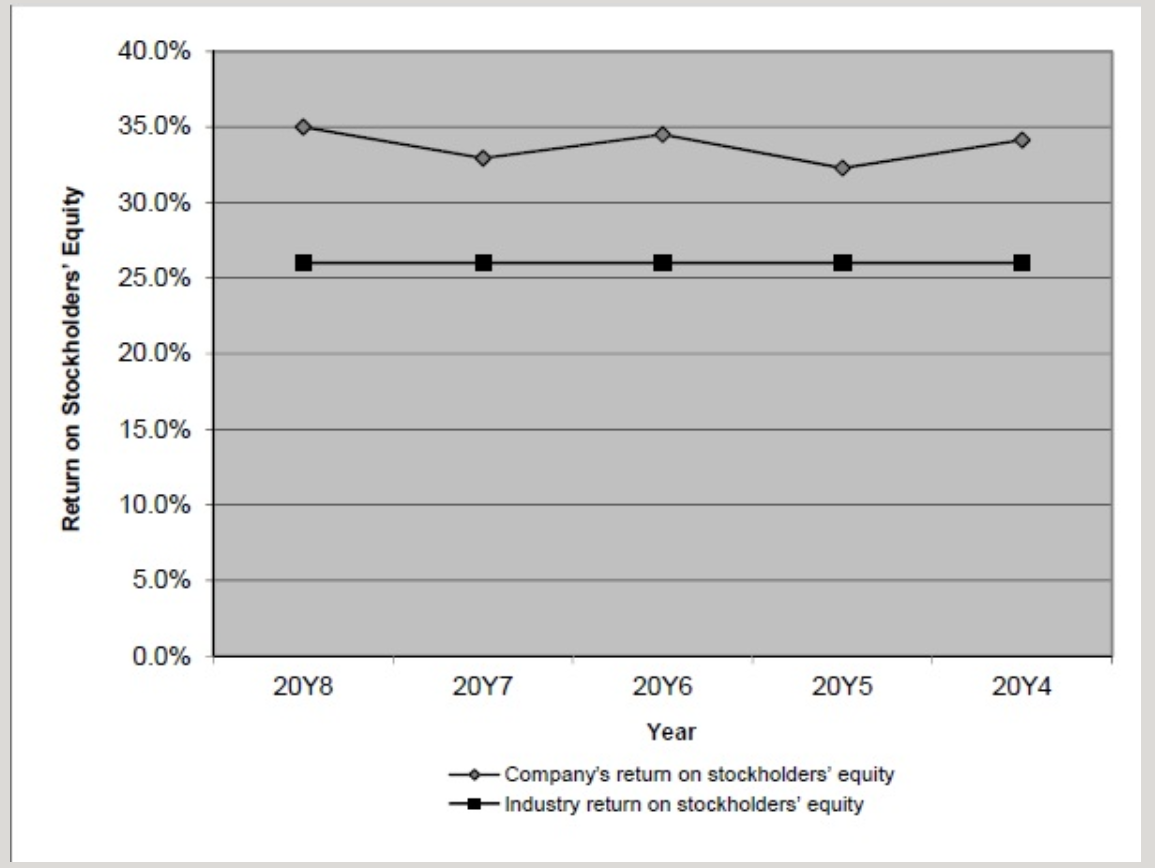
| 20Y8 | fill in the blank 6 % |
| 20Y7 | fill in the blank 7 % |
| 20Y6 | fill in the blank 8 % |
| 20Y5 | fill in the blank 9 % |
| 20Y4 | fill in the blank 10 % |
c. Times interest earned: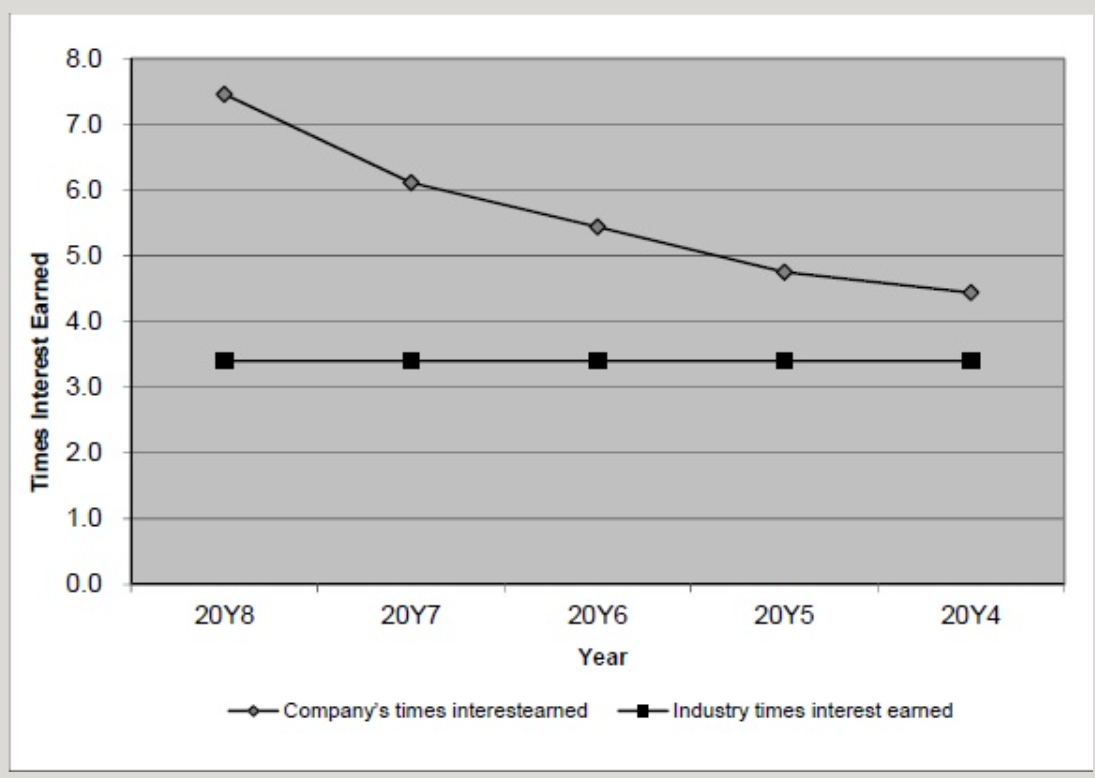
| 20Y8 | fill in the blank 11 |
| 20Y7 | fill in the blank 12 |
| 20Y6 | fill in the blank 13 |
| 20Y5 | fill in the blank 14 |
| 20Y4 | fill in the blank 15 |
d. Ratio of liabilities to stockholders' equity: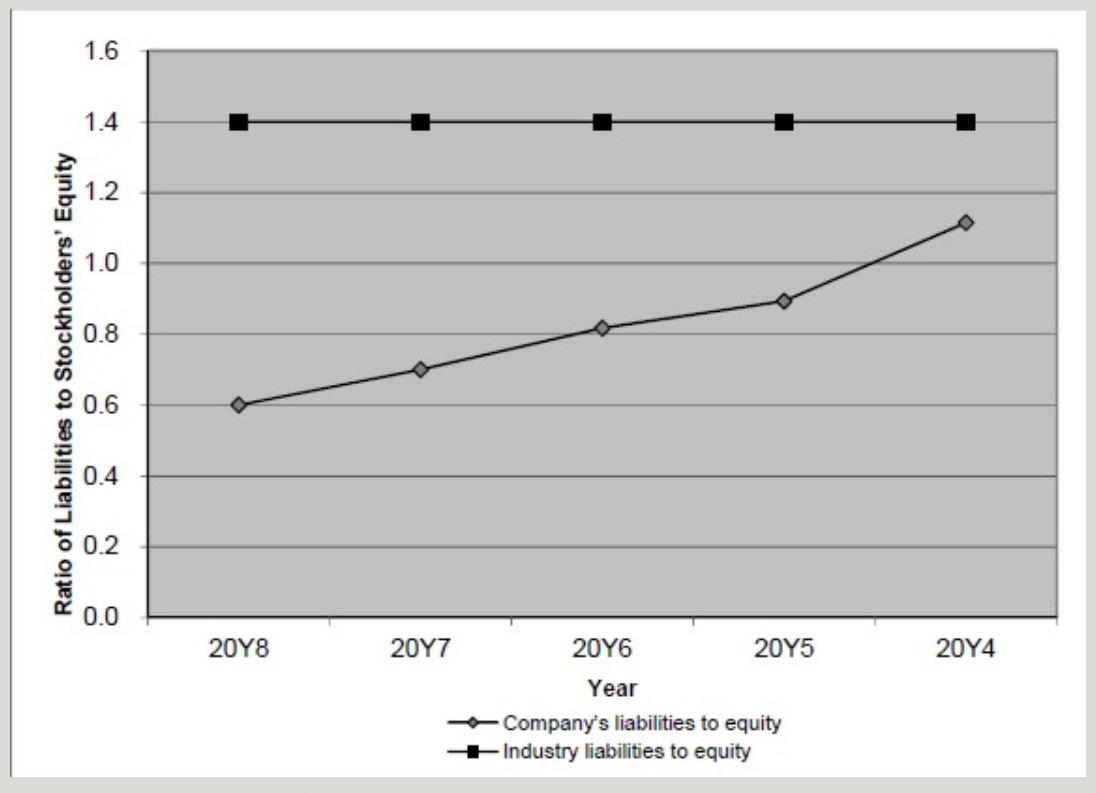
| 20Y8 | fill in the blank 16 |
| 20Y7 | fill in the blank 17 |
| 20Y6 | fill in the blank 18 |
| 20Y5 | fill in the blank 19 |
| 20Y4 | fill in the blank 20 |
2. Refer to the selected industry ratios provided above. Overall, these ratios indicate
strongweak
financial performance coupled with
appropriateinappropriate
use of debt (leverage).
a. Return on total assets: 30.0% 25.0% 20.0% Return on Total Assets 15.0% 10.0% 5.0% 0.0% 20Y8 2014 2017 2046 2045 Year Company's return on total assets +Industry return on total assets 40.0% 35.0% 30.0% 25.0% Return on Stockholders' Equity 20.0% 15.0% 10.0% 5.0% 0.0% 2048 2074 2017 2016 2045 Year Company's return on stockholders' equity Industry return on stockholders' equity 8.0 7.0 6.0 5.0 4.0 Times Interest Earned 3.0 1.0 0.0 20Y8 2047 20Y6 2015 2074 Year Company's times interestearned +Industry times interest eamed 1.6 1.4 1.2 1.0 0.8 Ratio of Liabilities to Stockholders' Equity 0.6 0.4 0.2 0.0 20Y8 2047 2074 2046 2015 Year Company's liabilities to equity Industry liabilities to equityStep by Step Solution
There are 3 Steps involved in it
Step: 1

Get Instant Access to Expert-Tailored Solutions
See step-by-step solutions with expert insights and AI powered tools for academic success
Step: 2

Step: 3
Ace Your Homework with AI
Get the answers you need in no time with our AI-driven, step-by-step assistance
Get Started
Modern Auditing And Assurance Services
Authors: Philomena Leung, Paul Coram, Barry J. Cooper, Peter Richardson
5th Edition
1742168450, 978-1742168456