

Question
Cross Validation using: Validation Set Approach I need help creating a graph like this picture using Validation Set Approach. Below the picture is my R
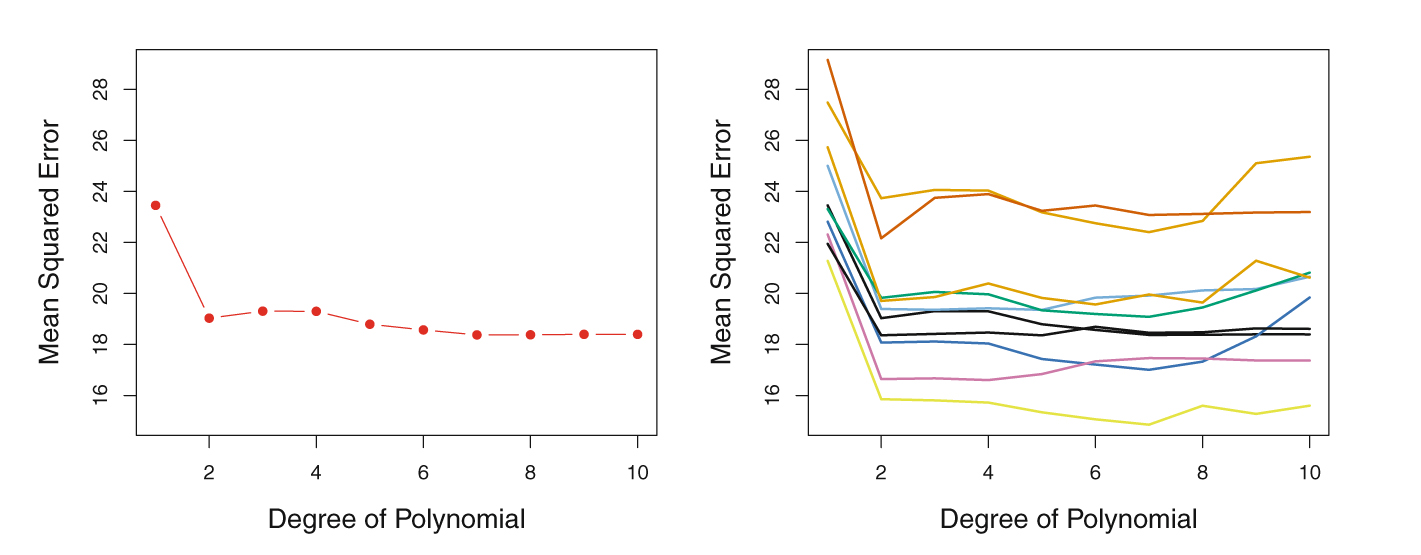
Cross Validation using: Validation Set Approach
I need help creating a graph like this picture using Validation Set Approach. Below the picture is my R Script for Validation Set Approach. I just can't figure how to replicate the graph like that one. I am pretty sure I need to use plot(x, y, ...) and use the degrees of polynomials as the variable x and mean square error as y variables to plot the graph but I cannot figure out how to code it. Thank you in advance for your help and suggestions.
the data set can be used in R using the following command
install.packeges("ISLR")
Step by Step Solution
There are 3 Steps involved in it
Step: 1

Get Instant Access to Expert-Tailored Solutions
See step-by-step solutions with expert insights and AI powered tools for academic success
Step: 2

Step: 3
Ace Your Homework with AI
Get the answers you need in no time with our AI-driven, step-by-step assistance
Get Started
Trigonometry
Authors: Cynthia Y Young
5th Edition
1119820928, 9781119820925