Answered step by step
Verified Expert Solution
Question
1 Approved Answer
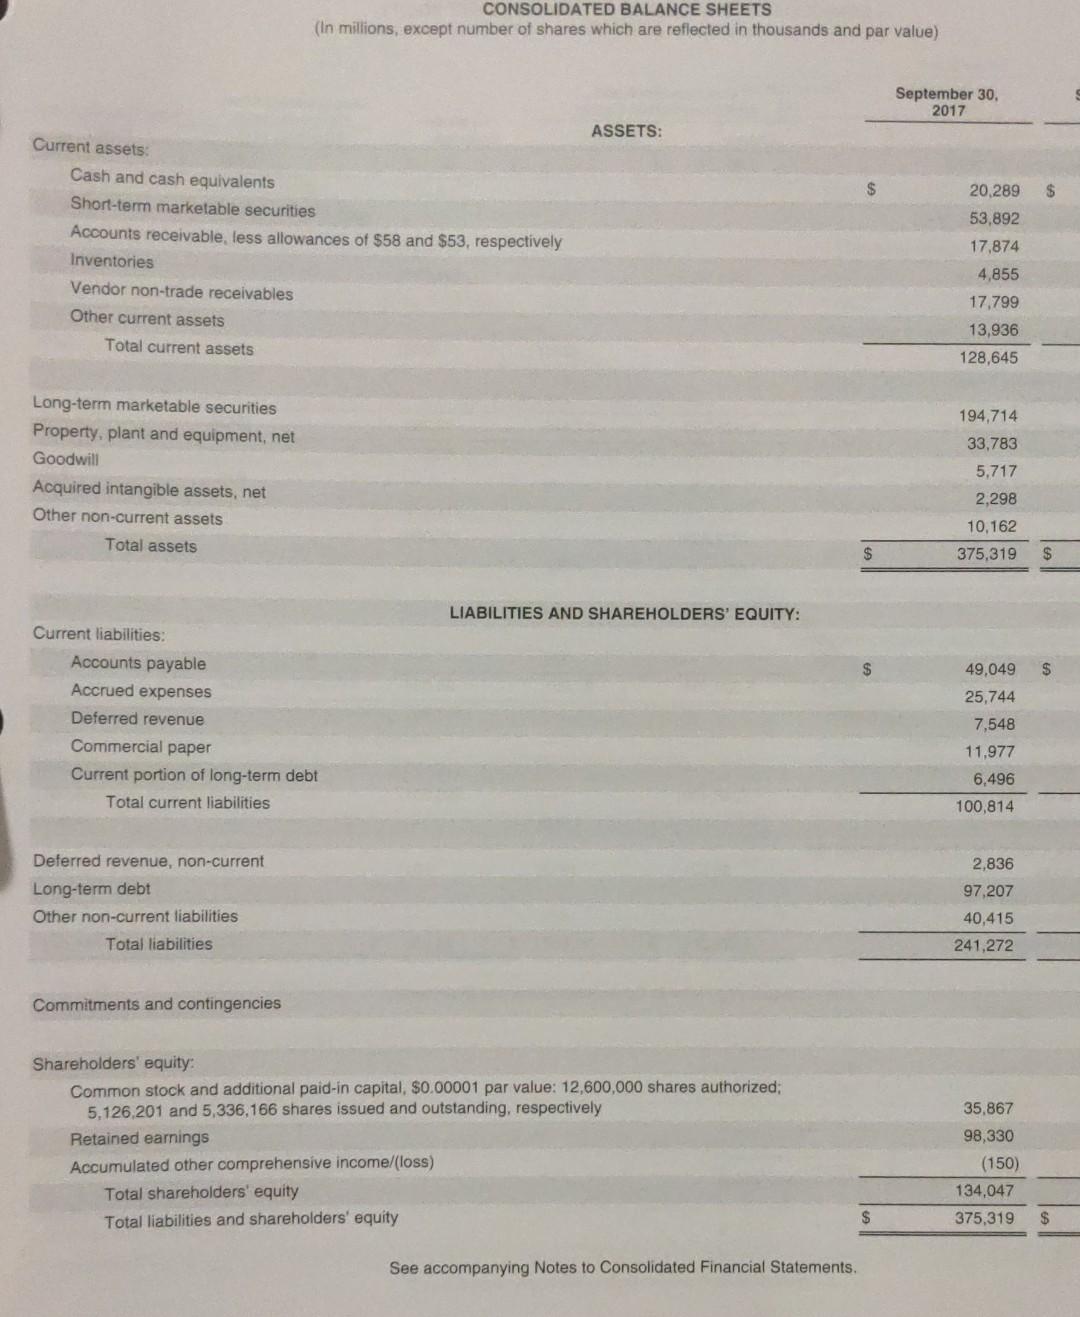
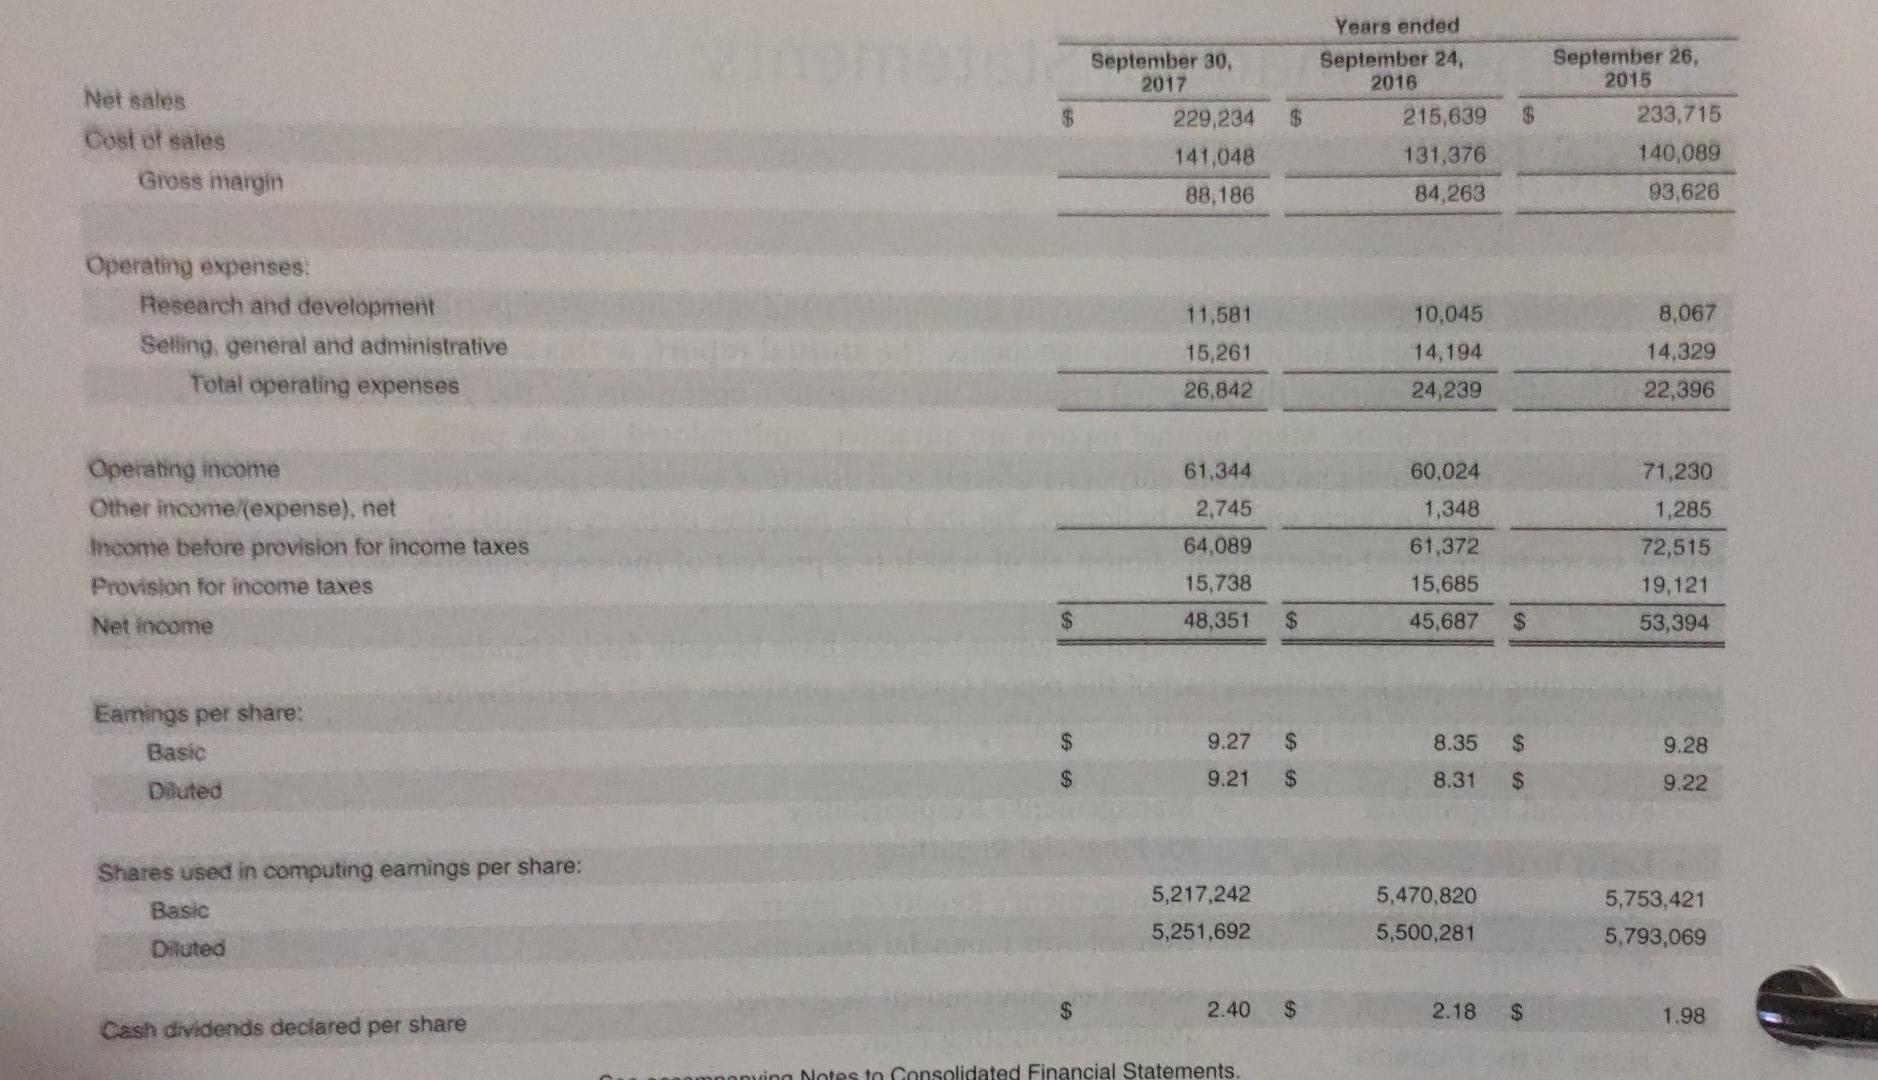
CT8.1 Refer to the financial statements of Apple Inc. in Appendix A. Instructions a. Calculate the accounts receivable turnover and average collection period for 2017.


CT8.1 Refer to the financial statements of Apple Inc. in Appendix A. Instructions a. Calculate the accounts receivable turnover and average collection period for 2017. (Assume all sales were credit sales.) b. Did Apple have any potentially significant credit risks in 2017? c. What conclusions can you draw from the information in parts (a) and (b)? CONSOLIDATED BALANCE SHEETS (In millions, except number of shares which are reflected in thousands and par value) S September 30, 2017 ASSETS: $ Current assets: Cash and cash equivalents Short-term marketable securities Accounts receivable, less allowances of $58 and $53, respectively Inventories Vendor non-trade receivables Other current assets Total current assets 20.289 $ 53,892 17,874 4,855 17.799 13,936 128,645 Long-term marketable securities Property, plant and equipment, net Goodwill Acquired intangible assets, net Other non-current assets Total assets 194,714 33,783 5,717 2,298 10,162 375,319 $ $ LIABILITIES AND SHAREHOLDERS' EQUITY: $ 49,049 $ 25,744 Current liabilities: Accounts payable Accrued expenses Deferred revenue Commercial paper Current portion of long-term debt Total current liabilities 7,548 11,977 6,496 100,814 2,836 Deferred revenue, non-current Long-term debt Other non-current liabilities Total liabilities 97,207 40,415 241,272 Commitments and contingencies 35,867 Shareholders' equity Common stock and additional paid-in capital, $0.00001 par value: 12,600,000 shares authorized; 5.126,201 and 5,336,166 shares issued and outstanding, respectively Retained earnings Accumulated other comprehensive income/(loss) Total shareholders' equity Total liabilities and shareholders' equity 98,330 (150) 134,047 375,319 $ $ See accompanying Notes to Consolidated Financial Statements. Years ended September 24, September 30, 2017 229,234 2016 $ $ 215,639 $ Net sales Cost of sales Gross margin September 26, 2015 233,715 140,089 93,626 141,048 131,376 84,263 88,186 Operating expenses Research and development Selling general and administrative Total operating expenses 11,581 15,261 26,842 10,045 14,194 8,067 14,329 22,396 24,239 60,024 1,348 Operating income Other income expense), net Income before provision for income taxes Provision for income taxes 61,344 2,745 64,089 15,738 48,351 71,230 1,285 72,515 19,121 61,372 15,685 45,687 Net income $ $ 53,394 Eamings per share: Basic $ 9.27 $ 8.35 9.28 $ $ fs 9.21 $ 8.31 $ Diluted 9.22 Shares used in computing eamings per share: Basic 5,217,242 5,470,820 5,500,281 5,753,421 5,793,069 5,251,692 Diluted $ 2.40 $ 2.18 $ 1.98 Cash dividends declared per share ving Notes to consolidated Financial Statements
Step by Step Solution
There are 3 Steps involved in it
Step: 1

Get Instant Access to Expert-Tailored Solutions
See step-by-step solutions with expert insights and AI powered tools for academic success
Step: 2

Step: 3

Ace Your Homework with AI
Get the answers you need in no time with our AI-driven, step-by-step assistance
Get Started


