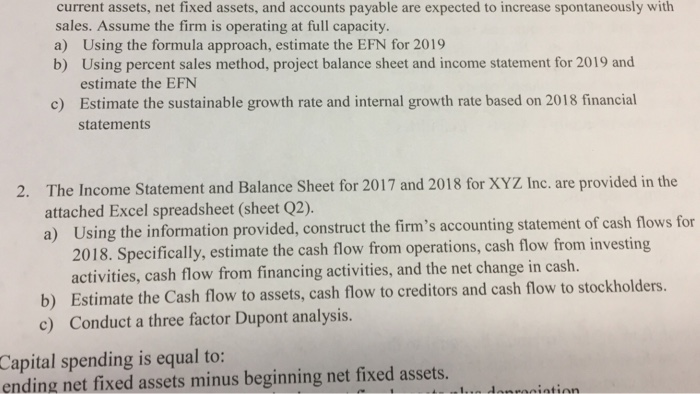
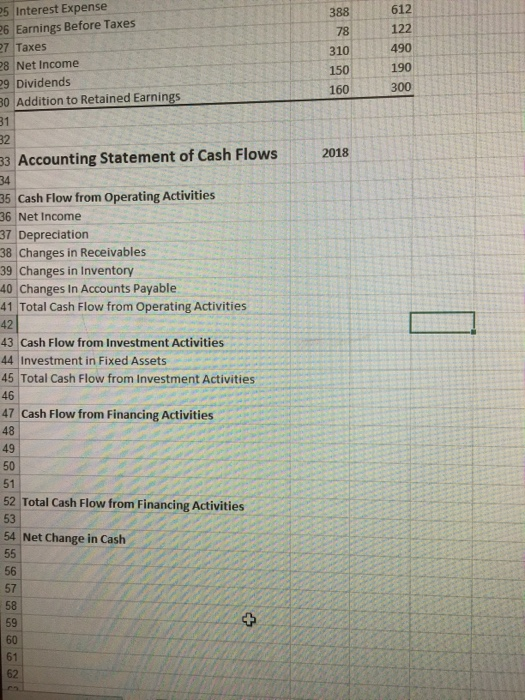
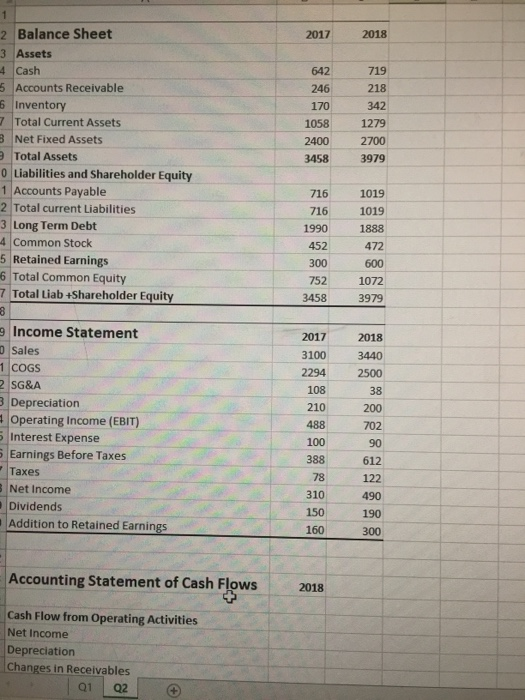
current assets, net fixed assets, and accounts payable are expected to increase spontaneously with sales. Assume the firm is operating at full capacity. a) Using the formula approach, estimate the EFN for 2019 b) Using percent sales method, project balance sheet and income statement for 2019 and estimate the EFN c) Estimate the sustainable growth rate and internal growth rate based on 2018 financial statements 2. The Income Statement and Balance Sheet for 2017 and 2018 for XYZ Inc. are provided in the attached Excel spreadsheet (sheet Q2). a) Using the information provided, construct the firm's accounting statement of cash flows for 2018. Specifically, estimate the cash flow from operations, cash flow from investing activities, cash flow from financing activities, and the net change in cash. b) Estimate the Cash flow to assets, cash flow to creditors and cash flow to stockholders. c) Conduct a three factor Dupont analysis. Capital spending is equal to: ending net fixed assets minus beginning net fixed assets. lan danciation 25 Interest Expense 26 Earnings Before Taxes 27 Taxes 28 Net Income 29 Dividends 30 Addition to Retained Earnings 2018 33 Accounting Statement of Cash Flows 35 Cash Flow from Operating Activities 36 Net Income 37 Depreciation 38 Changes in Receivables 39 Changes in Inventory 40 Changes in Accounts Payable 41 Total Cash Flow from Operating Activities 42 43 Cash Flow from Investment Activities 44 Investment in Fixed Assets 45 Total Cash Flow from Investment Activities 46 47 Cash Flow from Financing Activities 52 Total Cash Flow from Financing Activities 54 Net Change in Cash 2017 2018 2 Balance Sheet 3 Assets 4 Cash 5 Accounts Receivable 6 Inventory 7 Total Current Assets 3 Net Fixed Assets Total Assets 0 Liabilities and Shareholder Equity 1 Accounts Payable 2 Total current Liabilities 3 Long Term Debt 4 Common Stock 5 Retained Earnings 16 Total Common Equity 7 Total Liab +Shareholder Equity 642 246 170 1058 2400 3458 719 218 342 1279 2700 3979 716 716 1990 452 300 752 3458 1019 1019 1888 472 600 1072 3979 9 Income Statement Sales 1 COGS 2 SG&A 3 Depreciation Operating Income (EBIT) 5 Interest Expense 5 Earnings Before Taxes Taxes 3 Net Income Dividends Addition to Retained Earnings 2018 3440 2500 38 200 702 2017 3100 2294 108 210 488 100 388 78 310 150 160 90 Accounting Statement of Cash Flows 2018 Cash Flow from Operating Activities Net Income Depreciation Changes in Receivables Q1 Q2 current assets, net fixed assets, and accounts payable are expected to increase spontaneously with sales. Assume the firm is operating at full capacity. a) Using the formula approach, estimate the EFN for 2019 b) Using percent sales method, project balance sheet and income statement for 2019 and estimate the EFN c) Estimate the sustainable growth rate and internal growth rate based on 2018 financial statements 2. The Income Statement and Balance Sheet for 2017 and 2018 for XYZ Inc. are provided in the attached Excel spreadsheet (sheet Q2). a) Using the information provided, construct the firm's accounting statement of cash flows for 2018. Specifically, estimate the cash flow from operations, cash flow from investing activities, cash flow from financing activities, and the net change in cash. b) Estimate the Cash flow to assets, cash flow to creditors and cash flow to stockholders. c) Conduct a three factor Dupont analysis. Capital spending is equal to: ending net fixed assets minus beginning net fixed assets. lan danciation 25 Interest Expense 26 Earnings Before Taxes 27 Taxes 28 Net Income 29 Dividends 30 Addition to Retained Earnings 2018 33 Accounting Statement of Cash Flows 35 Cash Flow from Operating Activities 36 Net Income 37 Depreciation 38 Changes in Receivables 39 Changes in Inventory 40 Changes in Accounts Payable 41 Total Cash Flow from Operating Activities 42 43 Cash Flow from Investment Activities 44 Investment in Fixed Assets 45 Total Cash Flow from Investment Activities 46 47 Cash Flow from Financing Activities 52 Total Cash Flow from Financing Activities 54 Net Change in Cash 2017 2018 2 Balance Sheet 3 Assets 4 Cash 5 Accounts Receivable 6 Inventory 7 Total Current Assets 3 Net Fixed Assets Total Assets 0 Liabilities and Shareholder Equity 1 Accounts Payable 2 Total current Liabilities 3 Long Term Debt 4 Common Stock 5 Retained Earnings 16 Total Common Equity 7 Total Liab +Shareholder Equity 642 246 170 1058 2400 3458 719 218 342 1279 2700 3979 716 716 1990 452 300 752 3458 1019 1019 1888 472 600 1072 3979 9 Income Statement Sales 1 COGS 2 SG&A 3 Depreciation Operating Income (EBIT) 5 Interest Expense 5 Earnings Before Taxes Taxes 3 Net Income Dividends Addition to Retained Earnings 2018 3440 2500 38 200 702 2017 3100 2294 108 210 488 100 388 78 310 150 160 90 Accounting Statement of Cash Flows 2018 Cash Flow from Operating Activities Net Income Depreciation Changes in Receivables Q1 Q2


