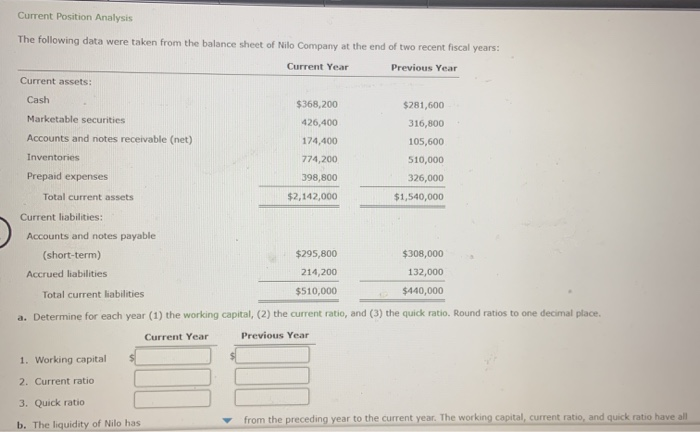
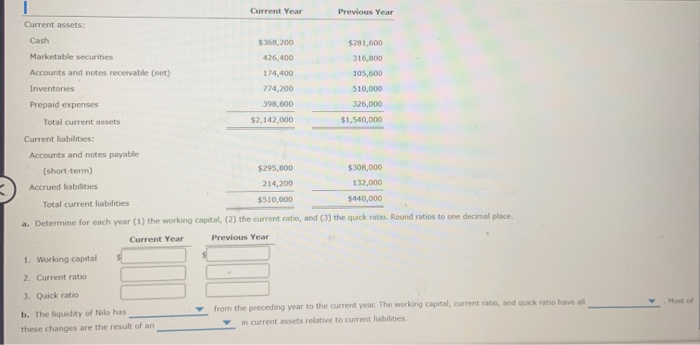
Current Position Analysis The following data were taken from the balance sheet of Nilo Company at the end of two recent fiscal years: Current Year Previous Year Current assets: Cash Marketable securities Accounts and notes receivable (net) Inventories Prepaid expenses $368,200 426,400 174,400 774,200 398,800 $2,142,000 $281,600 316,800 105,600 510,000 326,000 $1,540,000 Total current assets Current liabilities: Accounts and notes payable (short-term) $295,800 $308,000 Accrued liabilities 214,200 132,000 Total current liabilities $510,000 $440,000 a. Determine for each year (1) the working capital, (2) the current ratio, and (3) the quick ratio. Round ratios to one decimal place, Current Year Previous Year 1. Working capital 2. Current ratio 3. Quick ratio b. The liquidity of Nilo has from the preceding year to the current year. The working capital, current ratio, and quick ratio have all Current Year Previous Year Current assets: Cash $368,200 $281.600 Marketable securities 426,400 316,800 Accounts and notes receivable (net) 174,400 105,500 Inventories 774,200 510,000 Prepaid expenses 398,800 326,000 Total current assets $2,142,000 $1,540,000 Current liabilities: Accounts and notes payable (short-term) $295,800 $308,000 Accrued liabilities 214,200 132,000 $510,000 $440,000 Total current liabilities a. Determine for each year (1) the working capital, (2) the current ratio, and (3) the quick ratio. Round ratios to one decimal place Current Year Previous Year 1. Working capital 2. Current ratio 3. Quick ratio Most of b. The liquidity of Nilo has these changes are the result of an from the preceding year to the current year. The working capital, current ratio, and quick ratio have all in current assets relative to current liabilities