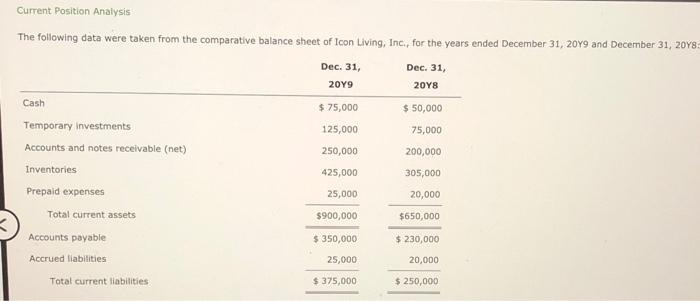


Current Position Analysis The following data were taken from the comparative balance sheet of Icon Living, Inc., for the years ended December 31, 2019 and December 31, 2018= Dec. 31, Dec. 31, 2049 2018 Cash $ 75,000 $50,000 Temporary Investments 125,000 75,000 Accounts and notes receivable (net) 250,000 200,000 Inventories 425,000 305,000 Prepaid expenses 25,000 20,000 Total current assets $900,000 $650,000 Accounts payable $ 350,000 $ 230,000 Accrued liabilities 25,000 20,000 Total current liabilities $375,000 $ 250,000 a. Determine for each year (1) the working capital, (2) the current ratio, and (3) the quick ratio. Round ratios to one decimal place. 2019 2048 Working capital Current ratio Quick ratio b. The liquidity of Icon Living, Inc., appears to have between 2018 and 2079 since the company's working capital increased. However, given that the current ratio and quick ratio It should be concluded that the company's liquidity declined from 2018 to 2049. These changes are the result of and change in the mix of current assets 2019 2018 Working capital Current ratio declined Quick ratio Improved b. The liquidity of Icon Living, Inc., appears to have between 2018 and 2019 since the company's working capital increased. However, given that the current ratio and quick ratio it should be concluded that the company's liquidity declined from 2078 to 209. These changes are the result of and change in the mix of current assets 2019 2018 Working capital Current ratio Quick ratio decreased Increased stayed the same b. The liquidity of Icon Living, In between 2018 and 2079 since the company's working capital increased. However, given that the current ratio and quick ratio It should be concluded that the company's equidity declined from 2078 to 2010. These changes are the result of and change in the mix of current assets 2049 2048 Working capital Current ratio Quick ratio an increase in current assets Inc., appears to have between 2018 and 2019 since the company's working capital increased. However, given that an increase in current liabilities it should be concluded that the company's liquidity declined from 2030 204. These changes are the result of and change in the mix of current assets


