

Question
Current ratio (Current assets CA / current liabilities CL) Quick ratio (CA - inventories / CL ) Answer the following questions and justify your answers
| Current ratio (Current assets CA / current liabilities CL) |
|
|
|
|
| Quick ratio (CA - inventories / CL ) |
|
|
|
|
|
|
|
|
|
|
| Answer the following questions and justify your answers (10 lines maximum in total) |
|
|
|
|
| Would you say the EPS has improved from a shareholder point if view ? |
|
|
|
|
| What about the P/E ratio ? |
|
|
|
|
| Has the net profit margin improved ? |
|
|
|
|
| Has the company better managed its inventory turnover? |
|
|
|
|
| Has the level of leverage increased in 2020? |
|
|
|
|
| Has the company been more efficient in managing its assets and generating profits ? |
|
|
|
|
| Would you say the company has a healthy current ratio and why |
|
|
|
|
the exercice is already done by an expert , i want the second part
thank you
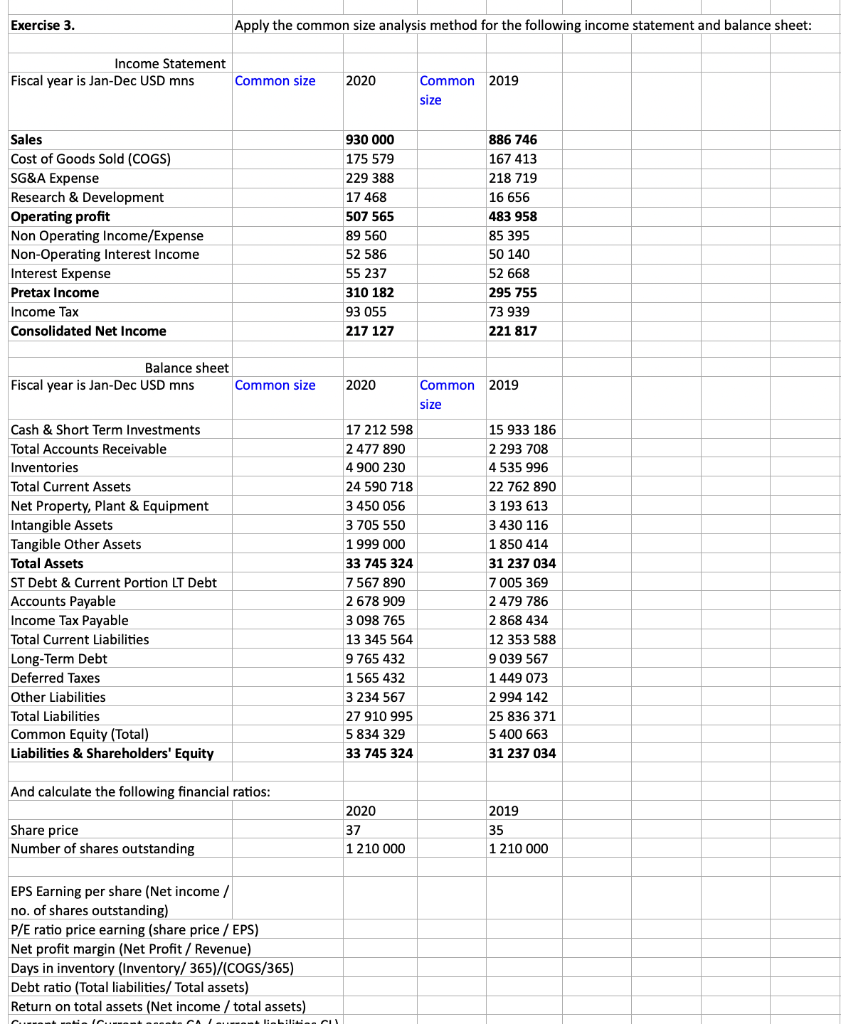
Exercise 3. Apply the common size analysis method for the following income statement and balance sheet: Income Statement Fiscal year is Jan-Dec USD mns Common size 2020 Common 2019 size Sales Cost of Goods Sold (COGS) SG&A Expense Research & Development Operating profit Non Operating Income/Expense Non-Operating Interest Income Interest Expense Pretax Income Income Tax Consolidated Net Income 930 000 175 579 229 388 17 468 507 565 89 560 52 586 55 237 310 182 93 055 217 127 886 746 167 413 218 719 16 656 483 958 85 395 50 140 52 668 295 755 73 939 221 817 Balance sheet Fiscal year is Jan-Dec USD mns Common size 2020 2019 Common size Cash & Short Term Investments Total Accounts Receivable Inventories Total Current Assets Net Property, Plant & Equipment Intangible Assets Tangible Other Assets Total Assets ST Debt & Current Portion LT Debt Accounts Payable Income Tax Payable Total Current Liabilities Long-Term Debt Deferred Taxes Other Liabilities Total Liabilities Common Equity (Total) Liabilities & Shareholders' Equity 17 212 598 2477 890 4 900 230 24 590 718 3 450 056 3 705 550 1 999 000 33 745 324 7 567 890 2 678 909 3 098 765 13 345 564 9 765 432 1565 432 3 234 567 27 910 995 5 834 329 33 745 324 15 933 186 2 293 708 4535 996 22 762 890 3 193 613 3 430 116 1850 414 31 237 034 7 005 369 2479 786 2 868 434 12 353 588 9 039 567 1 449 073 2 994 142 25 836 371 5 400 663 31 237 034 And calculate the following financial ratios: Share price Number of shares outstanding 2020 37 1 210 000 2019 35 1 210 000 EPS Earning per share (Net income / no. of shares outstanding) P/E ratio price earning (share price / EPS) Net profit margin (Net Profit / Revenue) Days in inventory (Inventory/365)/(COGS/365) Debt ratio (Total liabilities/ Total assets) Return on total assets (Net income / total assets) Cic.ca
Step by Step Solution
There are 3 Steps involved in it
Step: 1

Get Instant Access to Expert-Tailored Solutions
See step-by-step solutions with expert insights and AI powered tools for academic success
Step: 2

Step: 3
Ace Your Homework with AI
Get the answers you need in no time with our AI-driven, step-by-step assistance
Get Started
Statistics Modeling And Finance
Authors: Mark A Munizzo, Lisa Virruso Musial
1st Edition
0840049234, 9780840049230