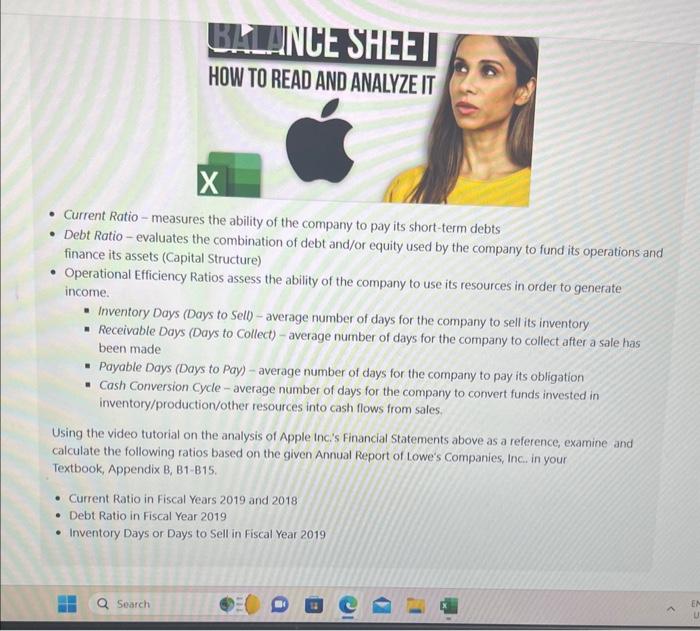
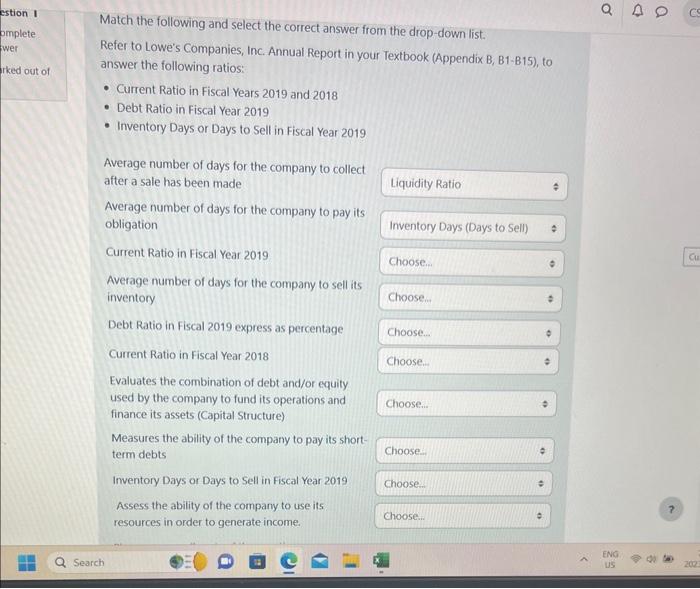
- Current Ratio-measures the ability of the company to pay its short-term debts - Debt Ratio - evaluates the combination of debt and/or equity used by the company to fund its operations and finance its assets (Capital Structure) - Operational Efficiency Ratios assess the ability of the company to use its resources in order to generate income. - Inventory Days (Days to Sell) - average number of days for the company to sell its inventory - Receivable Days (Days to Collect) - average number of days for the company to collect after a sale has been made - Payable Days (Days to Pay) - average number of days for the company to pay its obligation - Cash Conversion Cycle - average number of days for the company to convert funds invested in inventory/production/other resources into cash flows from sales. Using the video tutorial on the analysis of Apple inc.'s Financial Statements above as a reference, examine and calculate the following ratios based on the given Annual Report of Lowe's Companies, Inc., in your Textbook, Appendix B, B1-B15. - Current Ratio in Fiscal Years 2019 and 2018 - Debt Ratio in Fiscal Year 2019 - Inventory Days or Days to Sell in Fiscal Year 2019 - Current Ratio - measures the ability of the company to pay its short-term debts - Debt Ratio - evaluates the combination of debt and/or equity used by the company to fund its operations and finance its assets (Capital Structure) - Operational Efficiency Ratios assess the ability of the company to use its resources in order to generate income. - Inventory Days (Days to Sell) - average number of days for the company to sell its inventory - Receivable Days (Days to Collect) - average number of days for the company to collect after a sale has been made - Payable Days (Days to Pay) - average number of days for the company to pay its obligation - Cash Conversion Cycle - average number of days for the company to convert funds invested in inventory/production/other resources into cash flows from sales. Using the video tutorial on the analysis of Apple Inc.'s Financial Statements above as a reference, examine and calculate the following ratios based on the given Annual Report of Lowe's Companies, Inc. in your Textbook, Appendix B, B1-B15. - Current Ratio in Fiscal Years 2019 and 2018 - Debt Ratio in Fiscal Year 2019 - Inventory Days or Days to Sell in Fiscal Year 2019 estion I Match the following and select the correct answer from the drop-down list. Refer to Lowe's Companies, Inc. Annual Report in your Textbook (Appendix B, B1-B15), to answer the following ratios: - Current Ratio in Fiscal Years 2019 and 2018 - Debt Ratio in Fiscal Year 2019 - Inventory Days or Days to Sell in Fiscal Year 2019 Average number of days for the company to collect after a sale has been made Average number of days for the company to pay its obligation Current Ratio in Fiscal Year 2019 Average number of days for the company to sell its inventory Debt Ratio in Fiscal 2019 express as percentage Current Ratio in Fiscal Year 2018 Evaluates the combination of debt and/or equity used by the company to fund its operations and finance its assets (Capital Structure) Measures the ability of the company to pay its shortterm debts Inventory Days or Days to Sell in Fiscal Year 2019 Assess the ability of the company to use its resources in order to generate income. - Current Ratio-measures the ability of the company to pay its short-term debts - Debt Ratio - evaluates the combination of debt and/or equity used by the company to fund its operations and finance its assets (Capital Structure) - Operational Efficiency Ratios assess the ability of the company to use its resources in order to generate income. - Inventory Days (Days to Sell) - average number of days for the company to sell its inventory - Receivable Days (Days to Collect) - average number of days for the company to collect after a sale has been made - Payable Days (Days to Pay) - average number of days for the company to pay its obligation - Cash Conversion Cycle - average number of days for the company to convert funds invested in inventory/production/other resources into cash flows from sales. Using the video tutorial on the analysis of Apple inc.'s Financial Statements above as a reference, examine and calculate the following ratios based on the given Annual Report of Lowe's Companies, Inc., in your Textbook, Appendix B, B1-B15. - Current Ratio in Fiscal Years 2019 and 2018 - Debt Ratio in Fiscal Year 2019 - Inventory Days or Days to Sell in Fiscal Year 2019 - Current Ratio - measures the ability of the company to pay its short-term debts - Debt Ratio - evaluates the combination of debt and/or equity used by the company to fund its operations and finance its assets (Capital Structure) - Operational Efficiency Ratios assess the ability of the company to use its resources in order to generate income. - Inventory Days (Days to Sell) - average number of days for the company to sell its inventory - Receivable Days (Days to Collect) - average number of days for the company to collect after a sale has been made - Payable Days (Days to Pay) - average number of days for the company to pay its obligation - Cash Conversion Cycle - average number of days for the company to convert funds invested in inventory/production/other resources into cash flows from sales. Using the video tutorial on the analysis of Apple Inc.'s Financial Statements above as a reference, examine and calculate the following ratios based on the given Annual Report of Lowe's Companies, Inc. in your Textbook, Appendix B, B1-B15. - Current Ratio in Fiscal Years 2019 and 2018 - Debt Ratio in Fiscal Year 2019 - Inventory Days or Days to Sell in Fiscal Year 2019 estion I Match the following and select the correct answer from the drop-down list. Refer to Lowe's Companies, Inc. Annual Report in your Textbook (Appendix B, B1-B15), to answer the following ratios: - Current Ratio in Fiscal Years 2019 and 2018 - Debt Ratio in Fiscal Year 2019 - Inventory Days or Days to Sell in Fiscal Year 2019 Average number of days for the company to collect after a sale has been made Average number of days for the company to pay its obligation Current Ratio in Fiscal Year 2019 Average number of days for the company to sell its inventory Debt Ratio in Fiscal 2019 express as percentage Current Ratio in Fiscal Year 2018 Evaluates the combination of debt and/or equity used by the company to fund its operations and finance its assets (Capital Structure) Measures the ability of the company to pay its shortterm debts Inventory Days or Days to Sell in Fiscal Year 2019 Assess the ability of the company to use its resources in order to generate income


